UK September inflation data now out 17 Oct
- 0.6% prev
- yy 3.0% vs 3.0% exp vs 2.9% prev
- core CPI yy 2.7% vs 2.7% exp/prev
- Retail Price Index 275.1 vs 275.5 exp vs 274.7 prev
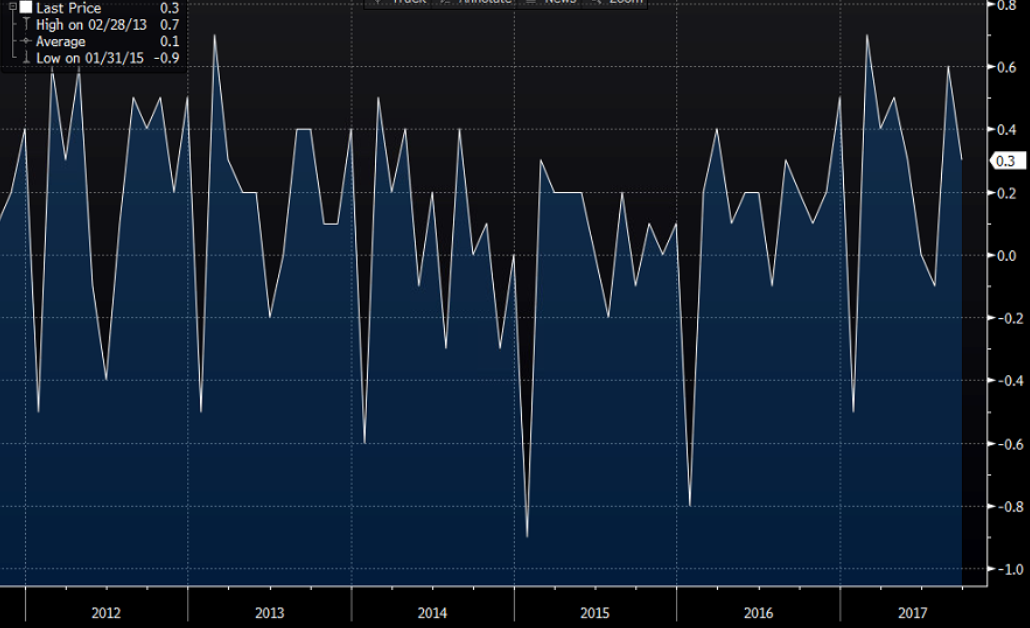
- RPI mm 0.1% vs 0.3% exp vs 0.7% prev
- yy 3.9% vs 4.0% exp vs 3.9% prev
- RPI ex mortgage interest payments yy 4.1% vs 4.2% exp vs 4.1% prev
CPI all in as per expectations and down tick in mm RPI sees GBPUSD down to 1.3258 from 1.3280. EURGBP spiked to 0.8880 only to run into sellers again and back to 0.8867
Says the ONS:
- Food prices and Transport (Airfares) costs pushed up inflation in September
- Annual inflation was last higher in Macrh 2012, when it printed 3.5%
- PPI saw upward effects from energy, offset by food, leaving rates unchanged annually
- Oil & fuel costs still on the rise but overall raw material prices and factory gate goods were little changed
- UK manufacturing sector bearing roughly same costs for materials/fuels as it did back in July 2014
- British Gas prices rise was not captured in the month's data (BG accounts for approx. 22% of UK market)
Full ONS report here.
Also out UK Sept PPI:
8.4% - PPI Input NSA (Y/Y) Sep: (est 8.20%; prev R 8.40%)
0.40% - PPI Input NSA (M/M) Sep: (est 1.20%; prev R 2.30%)
3.30% - PPI Output NSA (Y/Y) Sep: (est 3.30%; prev 3.40%)
0.20% - PPI Output NSA (M/M) Sep: (est 0.20%; prev 0.40%)
2.50% - PPI Output Core NSA (Y/Y) Sep: (est 2.60%; prev 2.50%)
0.00% - PPI Output Core NSA (M/M) Sep: (est 0.10%; prev 0.20%)