
The "wall" was hit at the 100 day MA
The NZDUSD had one heck of a run higher in trading on Thursday. The pair ended up moving up about 2.18%. The range for the day was 148 pips with the pair closing up around 140 pips.
Big move higher on the day.
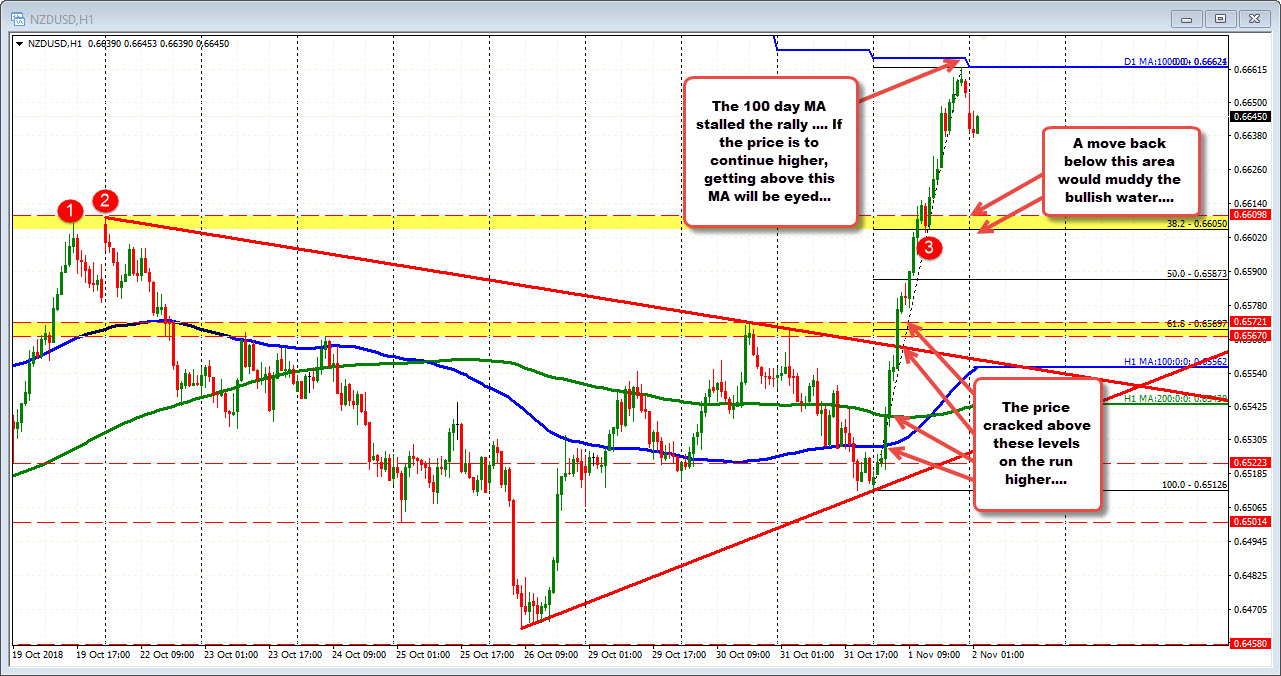
In the move higher, the pair cracked above the 100 and 200 hour MAs (blue and green lines in the chart above), a topside trend line. Recent highs at 0.6567-72 and the October 22 high at 0.66098. The October 1 high at 0.6628 was the next hurdle.
Finally to prove all good things do indeed come to an end, the pair stalled at 0.6657. That level is just below the 100 day MA at 0.6662. Getting within 5 pips of the key 100 day MA is good enough. The price has backed off on the profit taking/sellers against the key MA.
Looking at the daily chart below, the last time the price traded above the 100 day MA was back on April 23rd way up at 0.7212. That was some 550 pips higher.

What now?
Well....The buyers/bulls now need to see a move above the 100 day MA. If done, the sellers against the MA, will likely turn to buyers.
There is room to roam on the topside. Staying on the daily chart below, the September high reached around 0.6700. After that, the swing high at the end of August reached 0.67259.
In reality, a move to the 0.68106 is just 38.2% of the trend move lower. That is just a normal correction off the trend move lower this year.
What would spoil the bullish party now?
Looking back at the hourly chart, longs would start getting antsy if the price were to break below the 0.6600-10 area. The 38.2% of the trend move comes in at 0.6605. The swing high from October 22 comes in at 0.6610.

