Key MA at 0.8755
As the GBP moves higher as the BOE meeting (and an expected hike in rates) approaches, the EURGBP has also seen GBP strength (EURGBP moving lower).
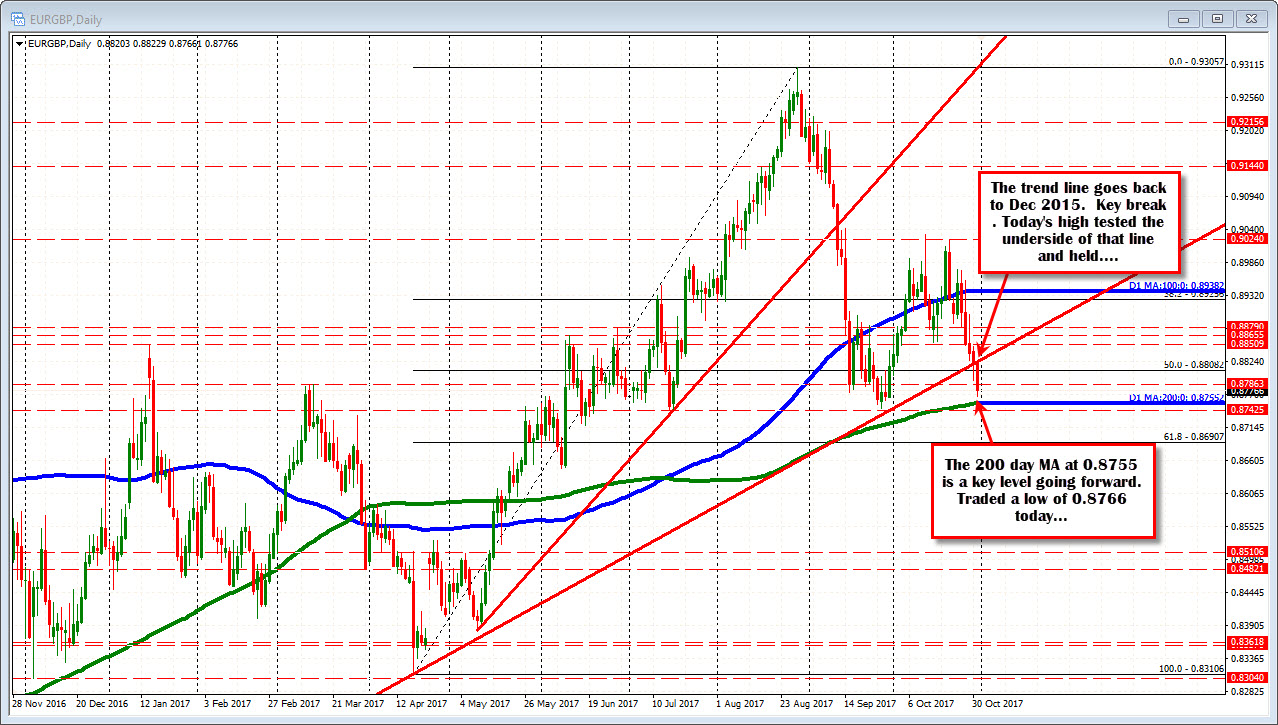
The pair traded at the lowest level this month and in the process has been able to break below a trend line going back to December 2015, and approach the key 200 day MA line at 0.8755. The low today reached 0.8766. The price currently trades at 0.8776.
Keep that 200 day MA in mind. A break below would quickly test lows from July and September 2017 at 0.8745 and 0.8742. Below that and the 61.8% of the move up from the April 2017 low (2017 low) comes in at 0.86907.
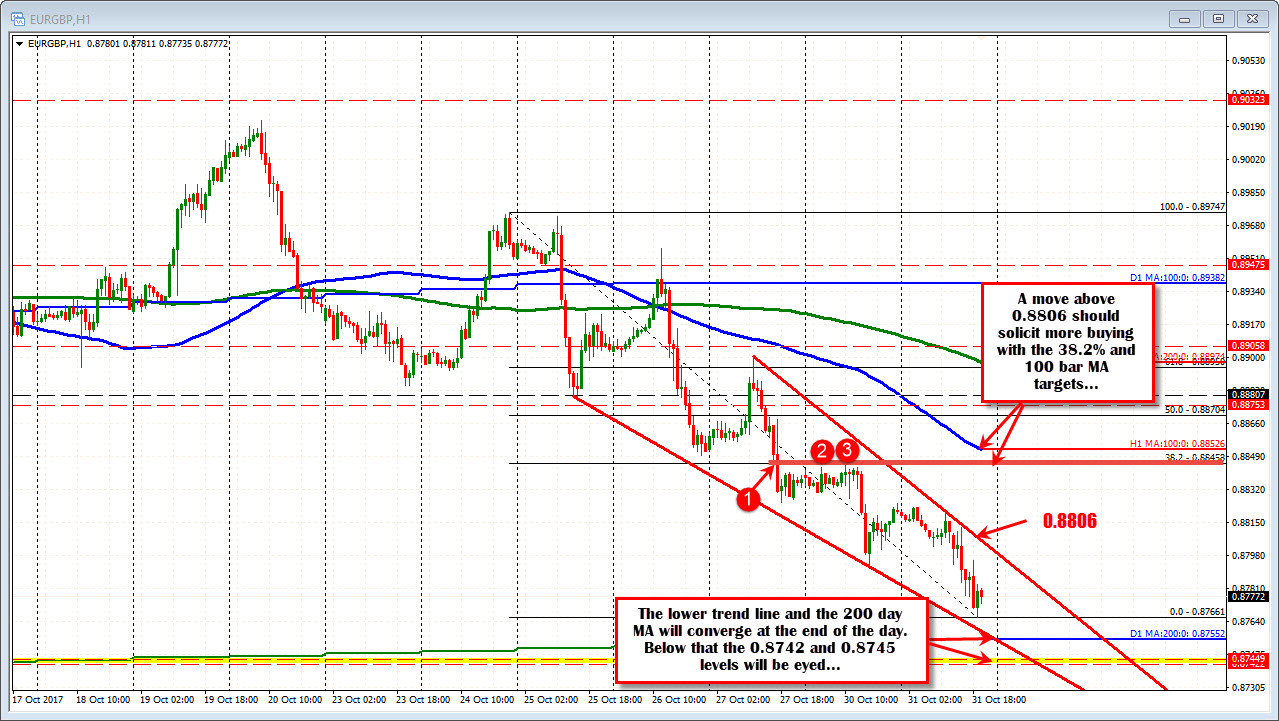
Looking at the hourly chart below, a lower trend line is moving toward convergence with the 200 day MA by the end of the day (and below it starting tomorrow). That trend line will be eyed as another potential support target. Of course it is moving lower and lower after each hour, so be sure to monitor it's level as time goes by.
ON the topside, there is a downward sloping trend line that comes in at 0.8806 currently. It too is moving lower. A move above could solicit more corrective buying with the 38.2% and the falling 100 hour MA the obvious next targets. The 38.2% is also home to prior swing lows/highs (see red circles). The 100 hour MA is moving toward that key area.