
Be watchful of some technical intraday bearish clues
The price of bitcoin is up about $328 today or 3.11%. The high reached $11,845.33. The low reached $10,549.51. We currently trade and $11,242.65 - near the midpoint of the day's trading range.
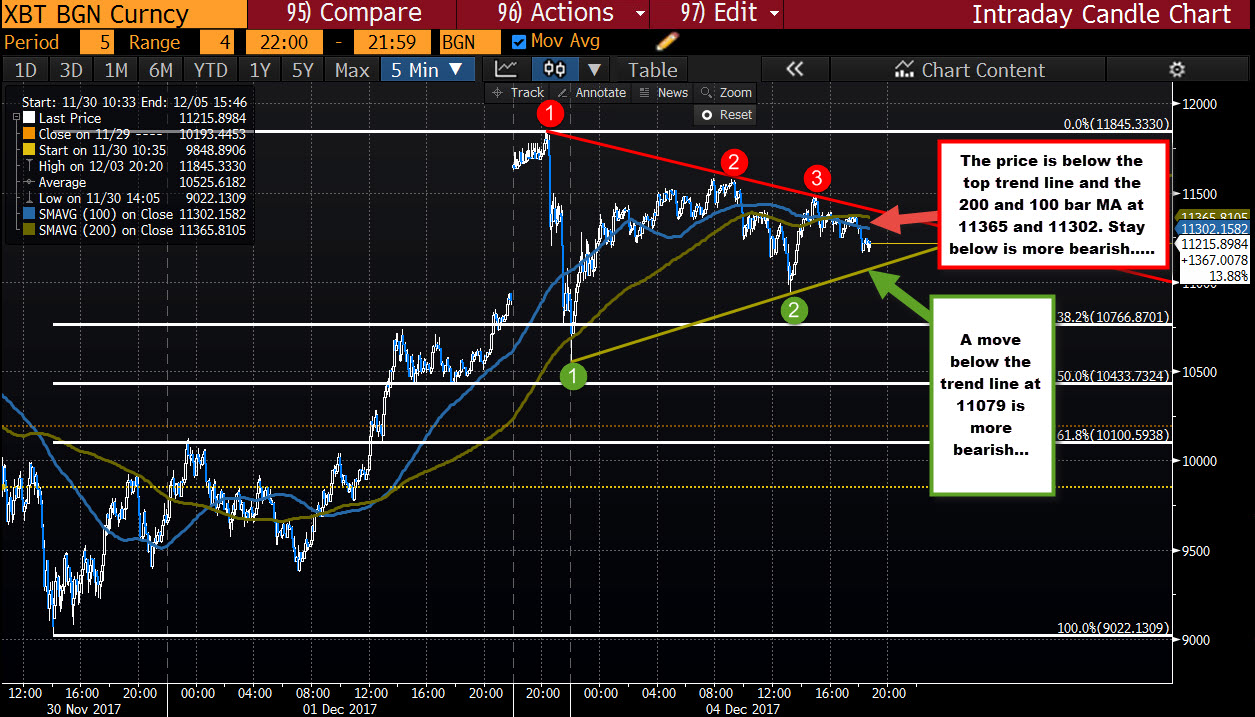
However, looking at the 5 minute chart, there are some small bearish clues developing.
- The last price rally stalled near a topside trend line. That is a little bearish (see red circles and red line)
- The price has since moved below both the 100 bar moving average in the 200 bar moving averages (blue and green line in the chart above). They come in at $11,365 and $11,302. Staying below is more bearish.
Not so bearish is that the price remains above a lower trend line that comes in at $11,079 currently (and moving higher). A move below that line would increase the bearishness from the intraday perspective.
So what next?
As long as the price stays below the two moving averages, and the falling topside trend line (it is at $11,400 now), the bears have a little advantage. We have to be aware of the potential for further declines. If it moves above the MA levels at $11,302 and $11,365 and then the trendline at $11,400, all bets are off - the buyers are back in control.
On a break of the lower trendline at $11,079, the next target becomes the 38.2% retracement at $10,766.87

