
Selling intensifies on break of converged 100 and 200 hour MAs
Yesterday, bitcoin moved above the 200 hour MA and a trend line and I commented "Is Bitcoin making a bullish break?"
The answer was "Yes", but the price had to:
- Stay above the trend line, the most bullish.
- Test and stay above the 50% at $3948.2317, still bullish
- Test and stay above the 200 hour MA (green line in the chart below)
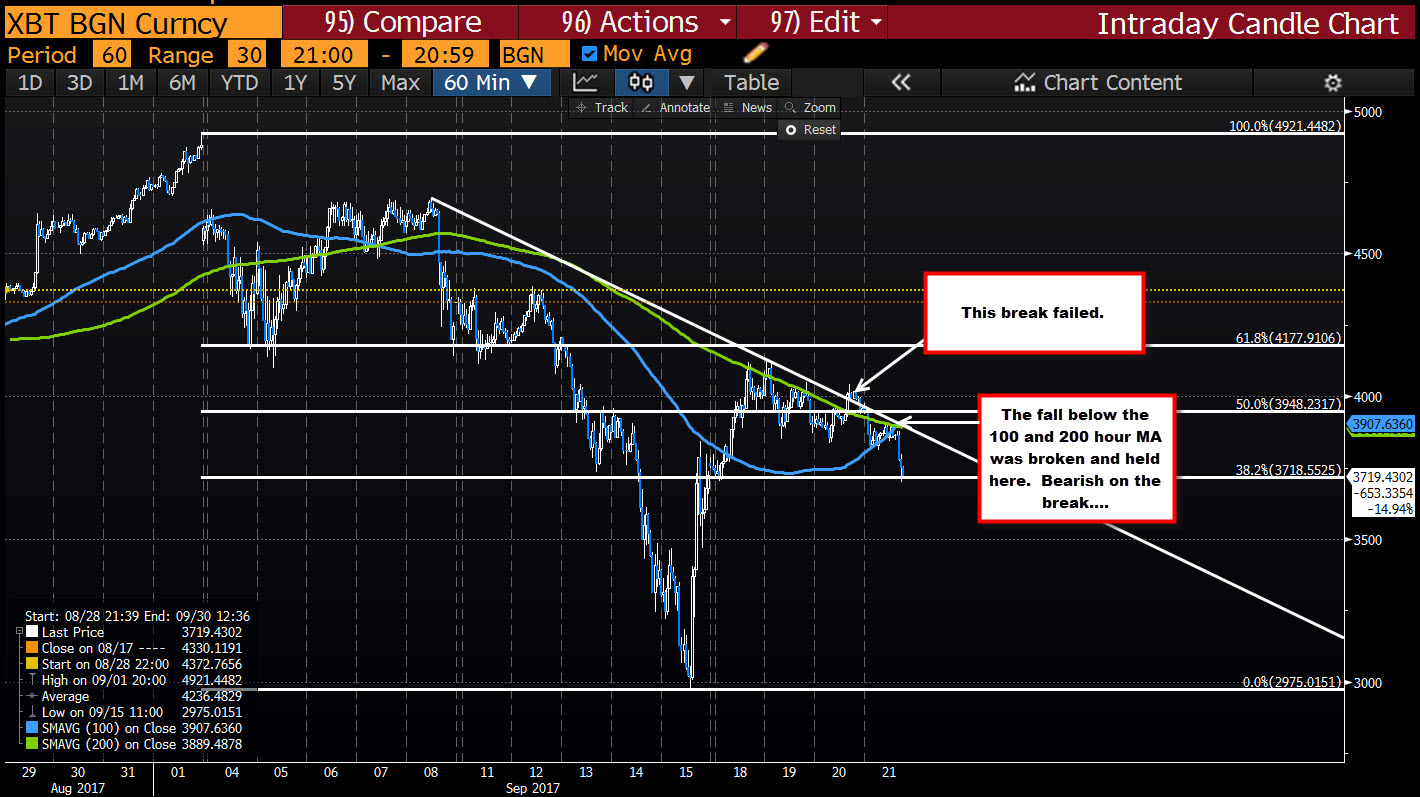
Well, looking at the chart above,
- The price fell back below the trend line. Less bullish.
- The price fell back below the 50% at $3948.2317 (and stayed below). Getting bearish.
- The price fell below the 200 hour MA (and stayed below) at 3889.487 currently. Bearish.
The price also fell below the lower but rising 100 hour MA (blue line) at $3907.636 currently.
All of that has led to a scoot lower in price toward the $3700 area.
The failure to break and run higher - especially above MAs - is telling me, that sellers are more in control in the market. For traders use these MAs as risk levels now.
Bitcoin was NOT making a bullish break yesterday. In fact, the pair made more of a bearish break after the failure to run higher. Sellers are back in control.

