3322-28 eyed above. 100 hour MA catching up below.
Late yesterday, I wrote a post about bitcoin. The theme? Pay attention to the technicals. The risks are simply too great. You can read the post here.
Anyway, what are the charts saying to me today?

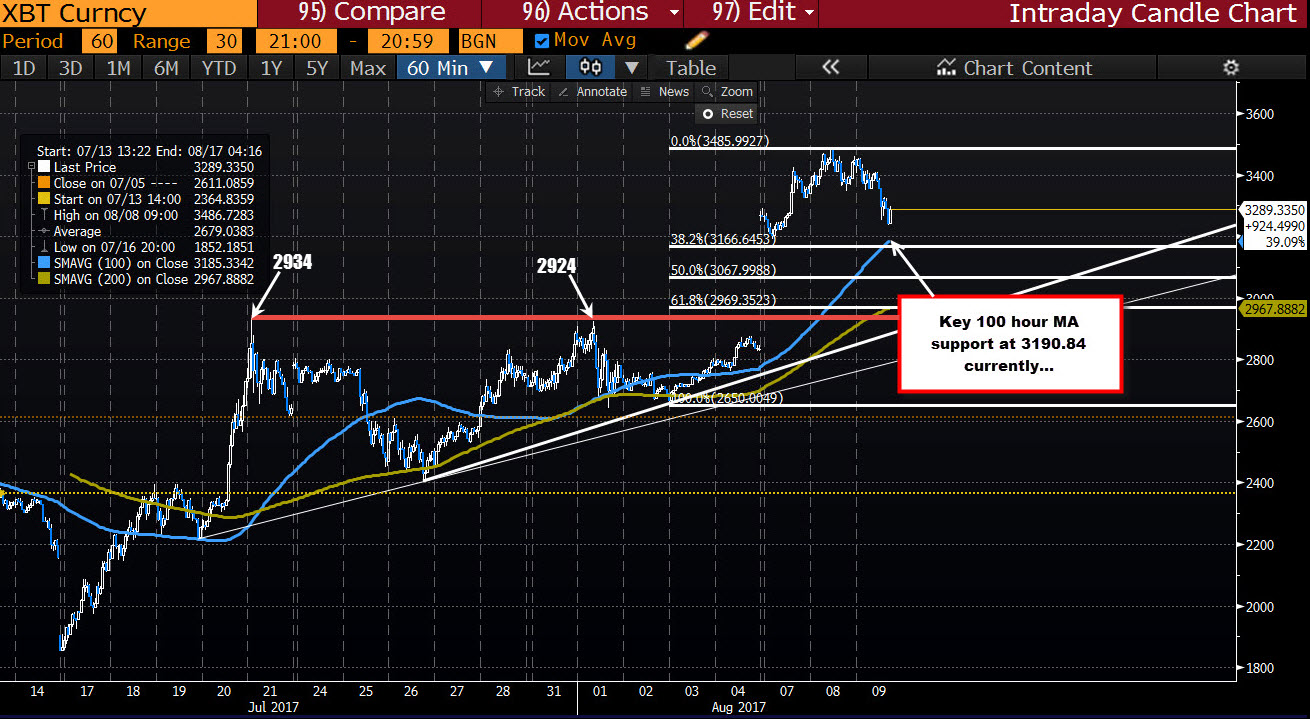
From the prior post the big gap over the weekend pushed the price to new highs and made the hourly chart and tools on that chart less useful. As time goes by, however, things like the MAs on the hourly chart, start to catch up.
Above is that hourly chart of bitcoin. as mentioned, the price gapped on Monday. The low on Monday reached 3191.91. The 100 hour MA is currently at 3190.84. That level is now key support. The MA is moving higher and will move above the Monday low, but pay attention to the 100 hour MA on the downside...There tends to be a reaction by traders against the MA line as risk can be defined and limited.
Of course, the corrective move today has not approached that MA line. The low has only reached 3237.36. Is there anything that stalled the fall?
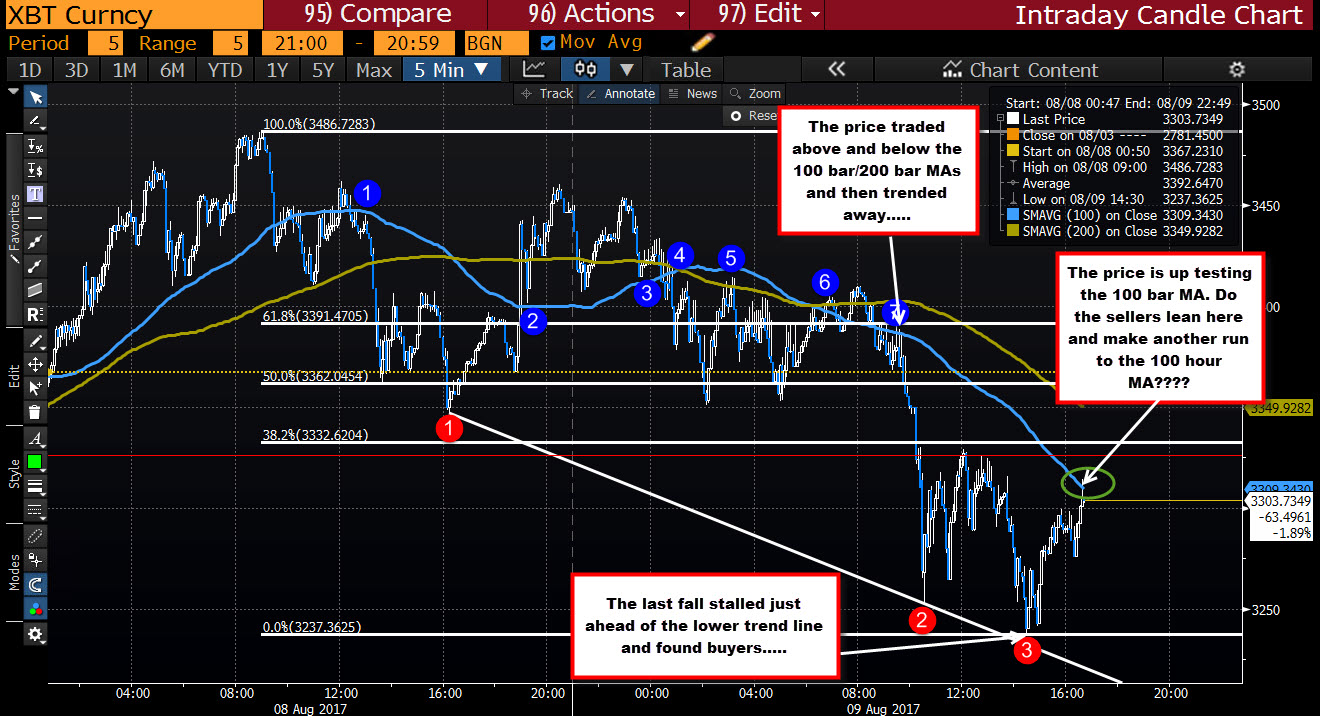
Drilling to the 5 minute chart below, the bitcoin moved below the 100 and 200 bar MAs earlier in the day and traders started to lean against the level (as a resistance ceiling - follow the blue numbered circles). The fall took the price closer to the 100 hour MA, but on the last dip, the price stalled just above a lower trend line on the 5 minute chart at 3232. The low reached 3237.
Buyers entered, and the price has moved back up to test the 100 bar MA at 3309.50 area. This is the first key test of the MA since the pair ran away from it earlier today. Will the sellers start to lean here? If the sellers enter, we should see a rotation lower with the 100 hour MA as the target. Key level.
So for the day, the corrective sellers have been more in control, BUT intraday support did hold. The sellers have to prove they mean business, by holding the 100 bar MA now. If it can hold, the corrective selling can continue with the 100 hour MA as a key target.
Anymore profit taking sellers out there?


