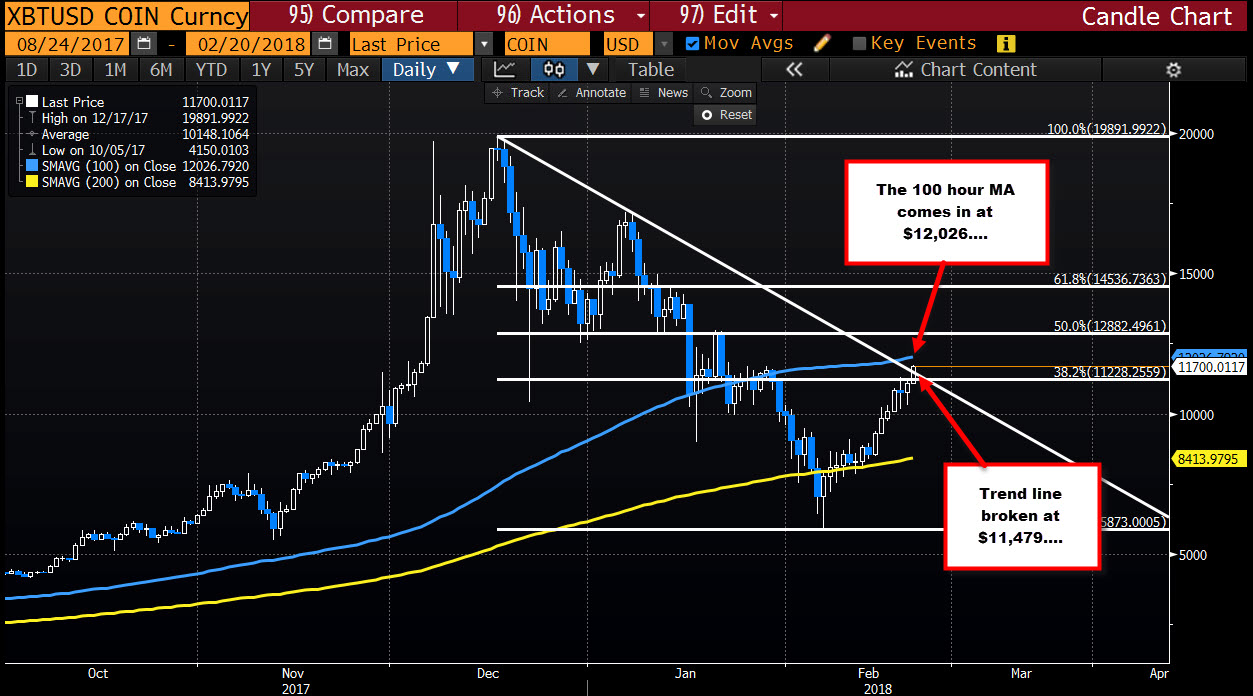
100 day MA at $12,026
The price of bitcoin continues its move to the upside after bouncing off the 100 hour MA on Sunday and Monday (blue line on the hourly chart below).
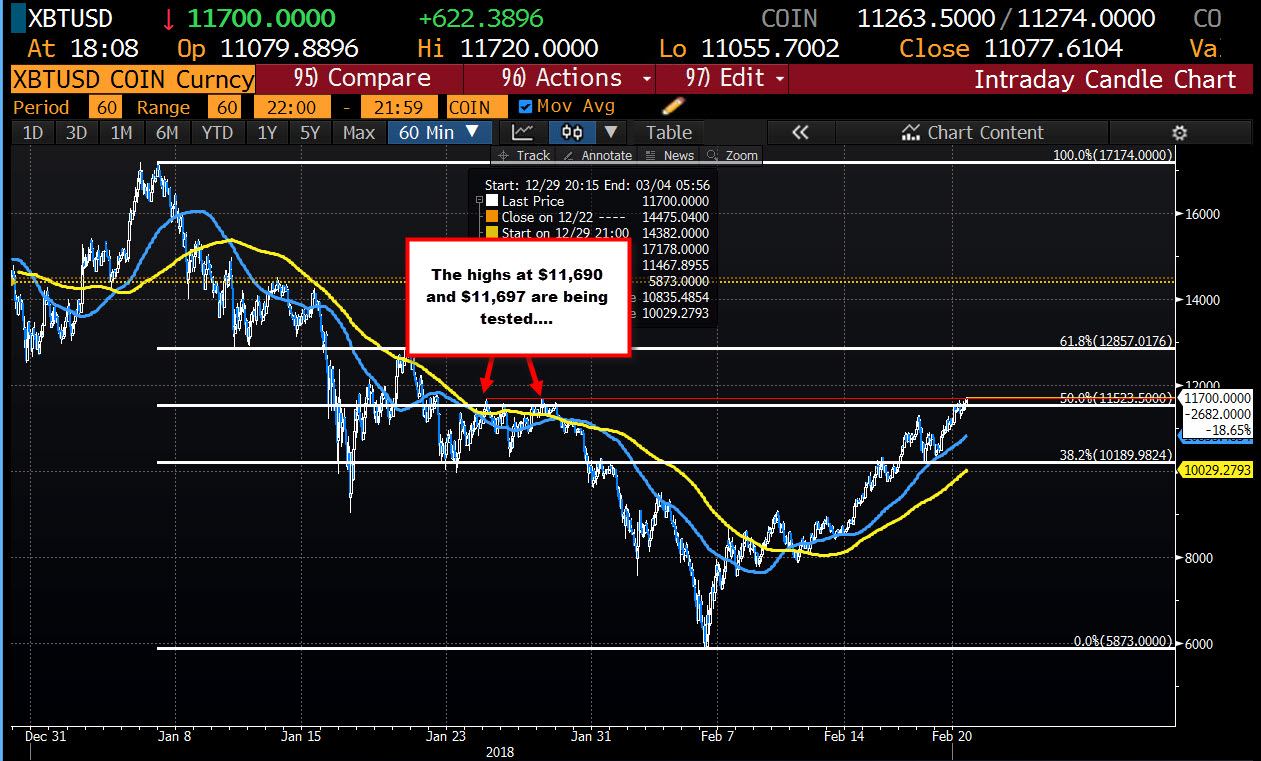
The digital currency just moved to a new session high at $11720. That took the price above the highs from January 25 and January 29th at $11690 and $11697 respectively. The price is also moving above the 50% of the move down from the 2018 high at $11,523.50. Those steps are in the bullish direction. The buyers remain in control.
Looking at the daily chart, the price today moved above a trend line at $11,479. Bullish.
What next?
The next key upside target comes in at 100 day MA at $12,026.75. That should be a tough nut to crack on the first look (with stops above). Be aware. It is approaching.