Tests a lower trend line
Looking at the 4-hour chart of the CADJPY, the pair has made a break below the 200 day MA at 84.915 and below the swing lows from October 26 at 84.848 and the November 20 low at 84.60. Traders will use those levels as risk defining levels. Falling below the 200 day MA swings more of the bias to the downside.
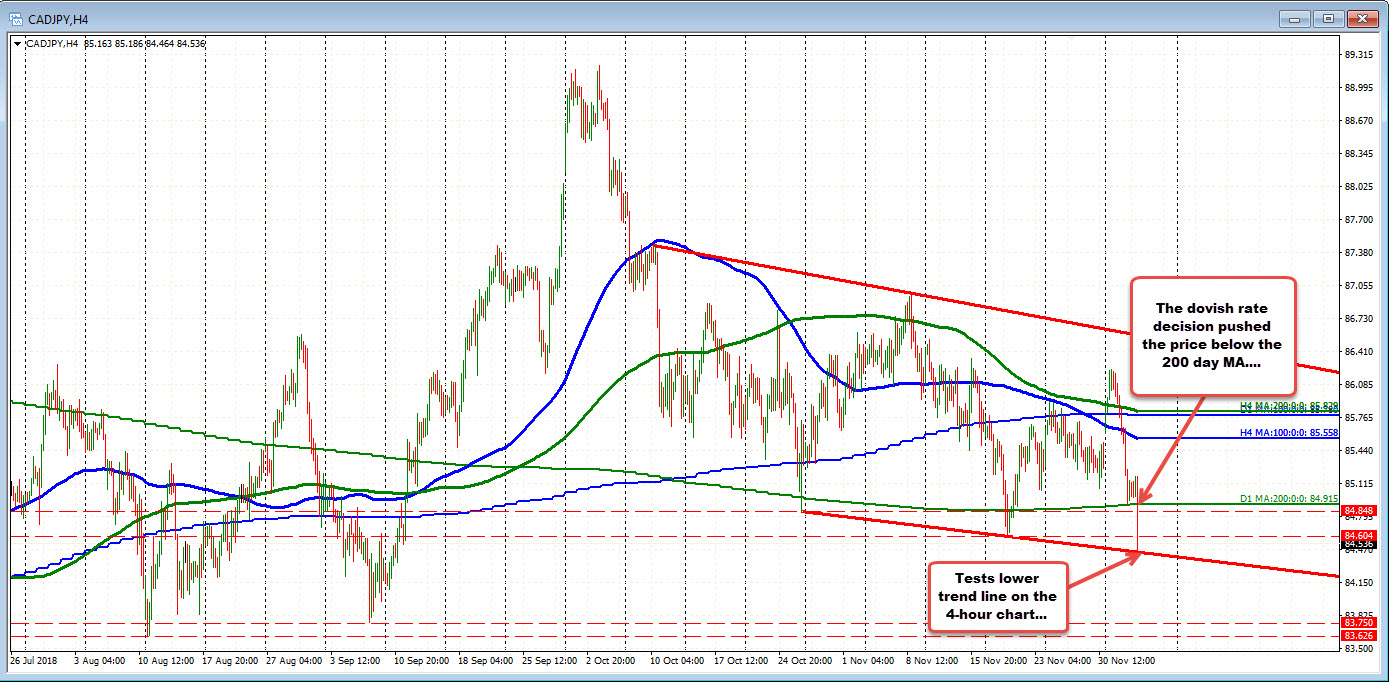
Now, the fall has reached a technical target against a lower trend line connecting the aforementioned swing lows in October and November. That low comes in at 84.44. The low price reached 84.46.
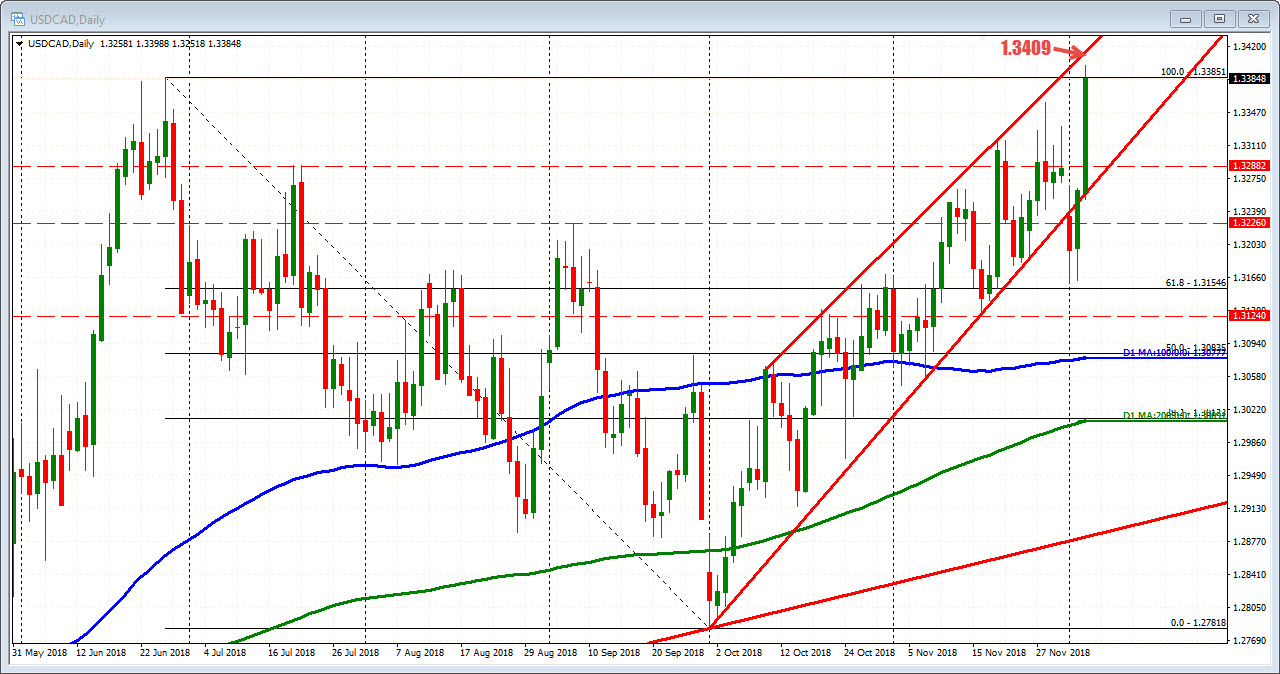
The USDCAD has moved to a new year high at 1.33988 (call it 1.3400). There is a topside trend line at 1.3409 area.