61.8% of the move down from the April 2016 high stalls the fall and the price is back above 1.1161-71.
What happened this week in the EURUSD?
- Simply... the EURUSD closed last Friday at 1.1193. We currently trade at 1.1194.
That says something, but what happened in between and what does it tell us technically?
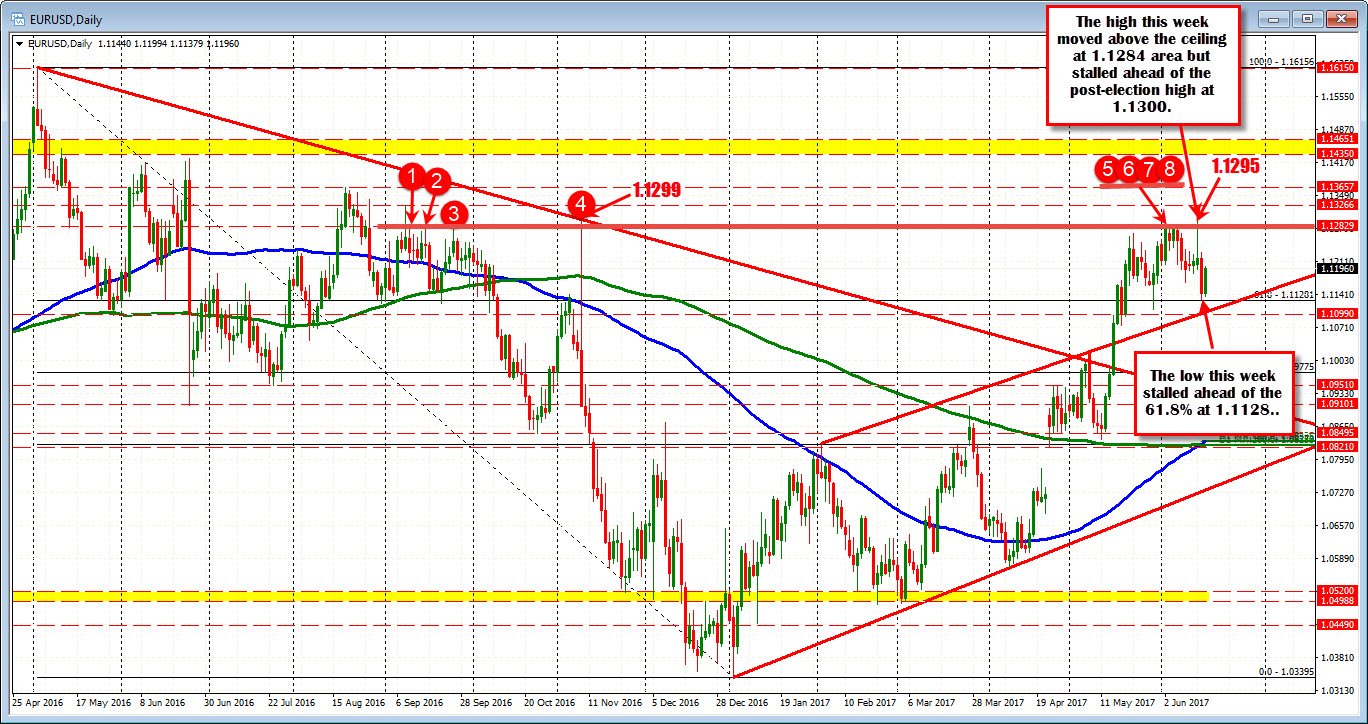
- The high price moved above a ceiling area at 1.1278-84 but stalled ahead of the 1.1300 level. The 1.1300 level is the high (give or take a pip) from after the US November election. The high this week reached 1.1295.
- The low price reached 1.1131. The 61.8% of the move down from the May high is at 1.1128. So support against the broken 61.8% held.
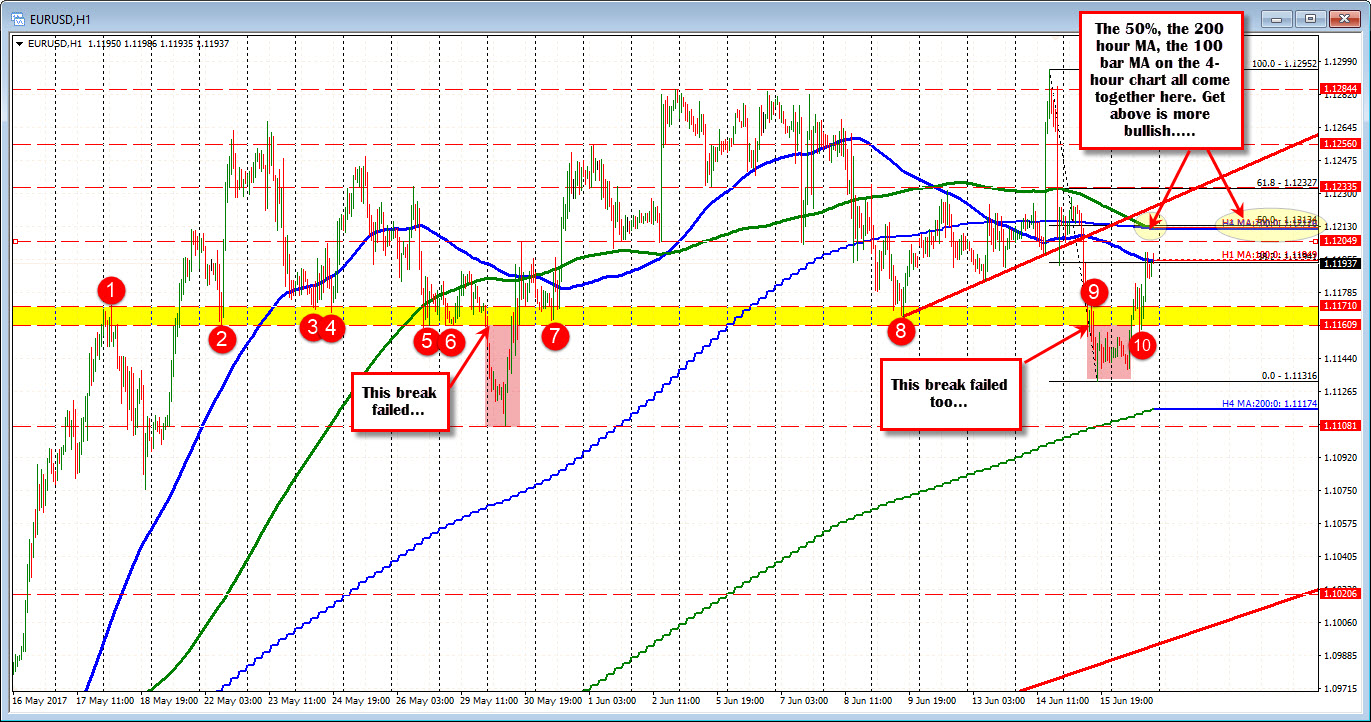
Drilling to the hourly chart, the 1.11609 to 1.1171 area (yellow area in the chart below) has been a higher support level for the EURUSD (vs the 61.8% on the daily). Looking at the hourly chart below, there have been a number of swing levels in that area (follow the red circles in the chart below).
Back on May 30th, the price DID fall below that floor and moved to 1.1108 before rebounding back above the 1.11609-71 area (see 1st red shaded area in the chart below)
On Thursday the price fell below the level again. The price should have gone lower. It did, but only to 1.11316. Today the price moved back above that key area, and is closing back above that level.
More bullish?
Let's just say the sellers had their shot this week. It was a big break. They failed.
The 1.1213 area is a key upside level in the new trading week. That is where the 200 hour MA, the 100 bar MA on the 4-hour chart and 50% retracement of the move down this week is found. Get above and the bulls are happier and we move higher.
Is there a 2nd chance for the sellers. We always have to define risk. Moving below 1.11609 is step one in the 2nd chance. It has to stay below though.
For now...bulls in control.