
113.32-38 is a strong ceiling
The USDJPY traders are leaning against a ceiling area on the hourly chart at 113.32-379 area. There are 6 separate tests that found sellers including in the last two hours of trading (see hourly chart below).
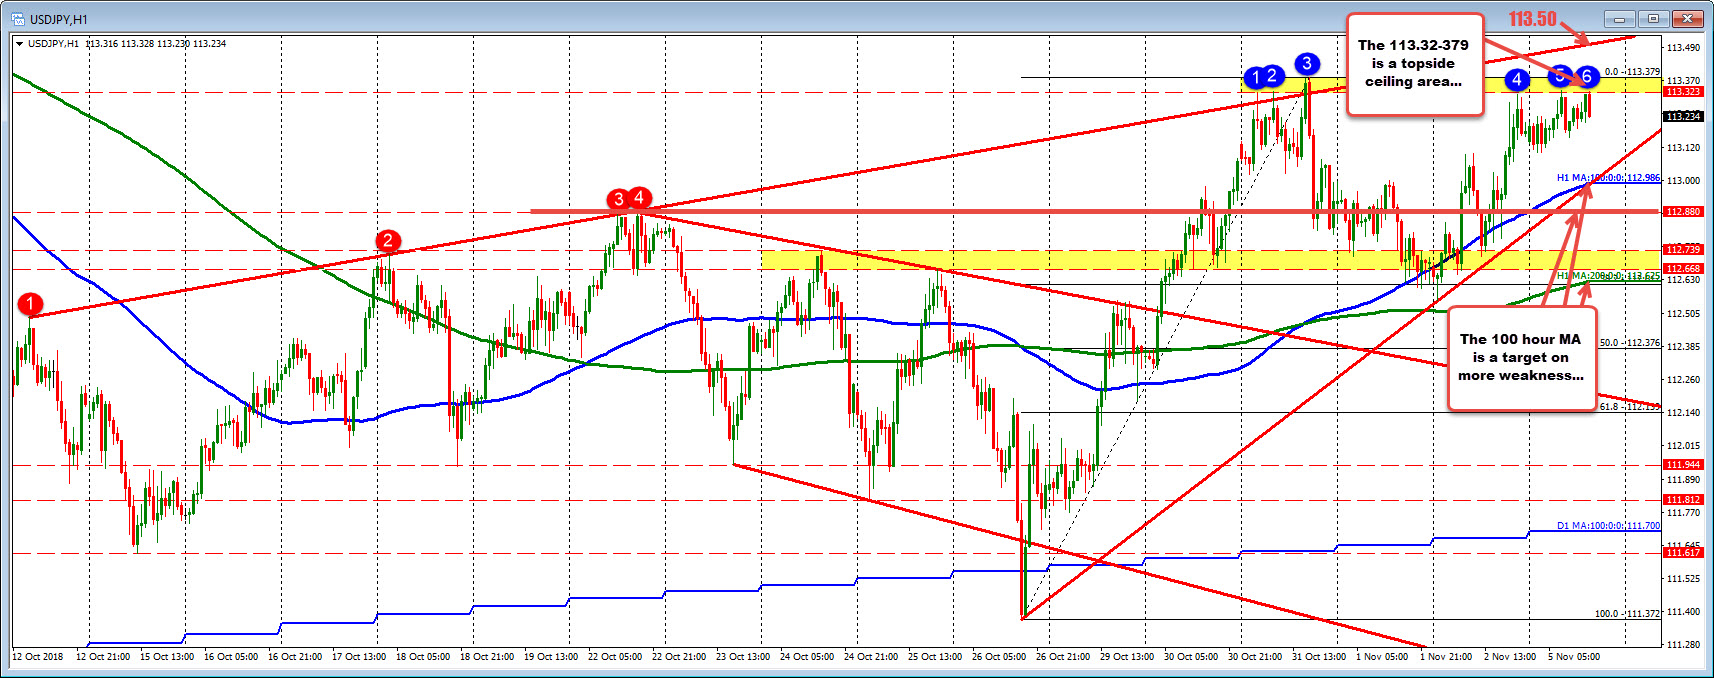
When traders lean against a level, the hope is a move toward an opposite target. That would be the 100 hour MA (blue line) and trend line at the 112.986 (call it 113.00). A move below that level opens up the downside for a more bearish move (112.88, 112.739, 112.668 and 100 hour MA at 112.625).
For buyers, a move above the 113.32-38 is the hurdle to get above. If done, the 113.50 will be eyed. A break above that area, opens the door for more upside momentum.

