
)
Risk is big but charts can help you
People ask me..."What do you think about trading bitcoin?"
My answer... You better know what you are getting into. (And this is helpful too! How to Buy Bitcoin and Ethereum as Simply and Securely as Possible)
Most people who ask me, have already heard the stories of how great owning bitcoin is...
- There is the limited supply story. If supply is limited and demand picks up, the demand will simply push the price higher and higher
- There is the distrust story about normal currencies like the USD and how the value will be eroded by central bankers who simply print new money.
- There are the stories of being anonymous (a tax evasion opportunity), or how it can be used for criminal activity and that in itself is a huge market that will only attract more and more buyers in the market (and force the price up)
The people that ask me about it, are usually already sold on some "story line".
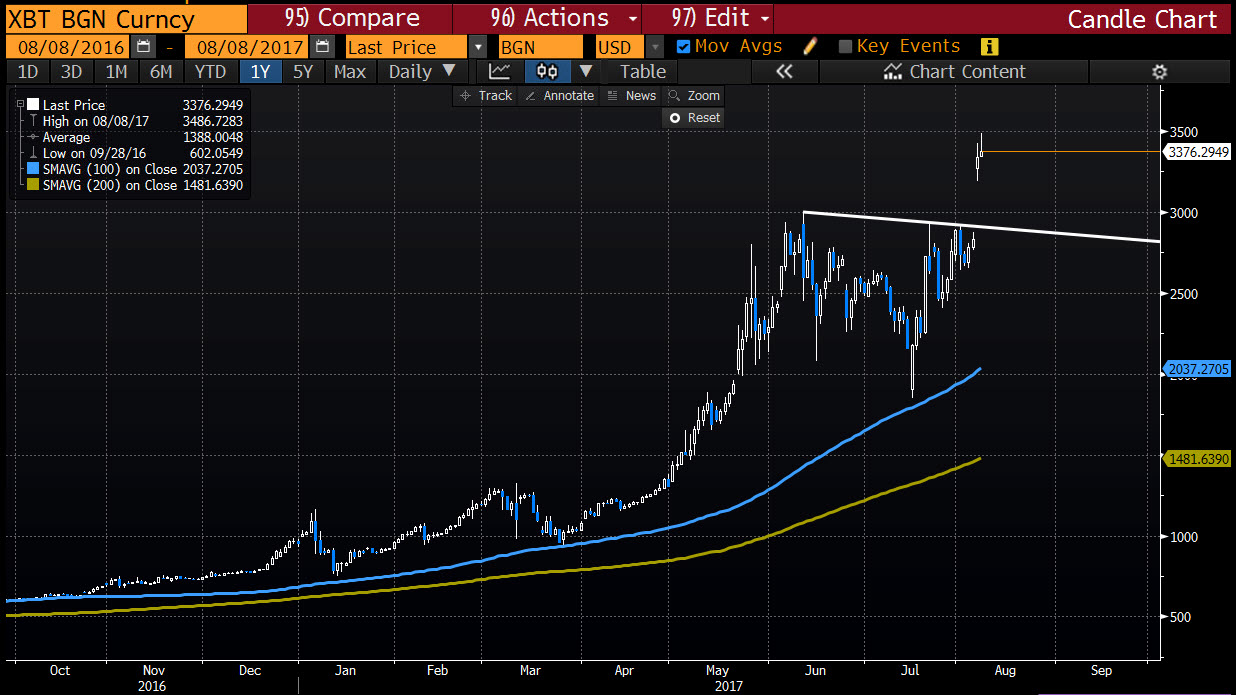
If you add - to whatever story they hear - a price trend that shows the price going from $600 to $3500, people go bonkers and just have to trade it. I don't blame them. If you catch a trend in bitcoin, you could be sitting on top of the world.
Nevertheless, what I warn all traders, is the risks associated with whatever you trade - whether bitcoin, stocks, currencies, bonds, oil or commodities - should be fully known. You should also be able to define your trade specific risk, and define a bias (bullish or bearish). The question you need to ask yourself, should not be focused on what you can make, but instead what you can lose.
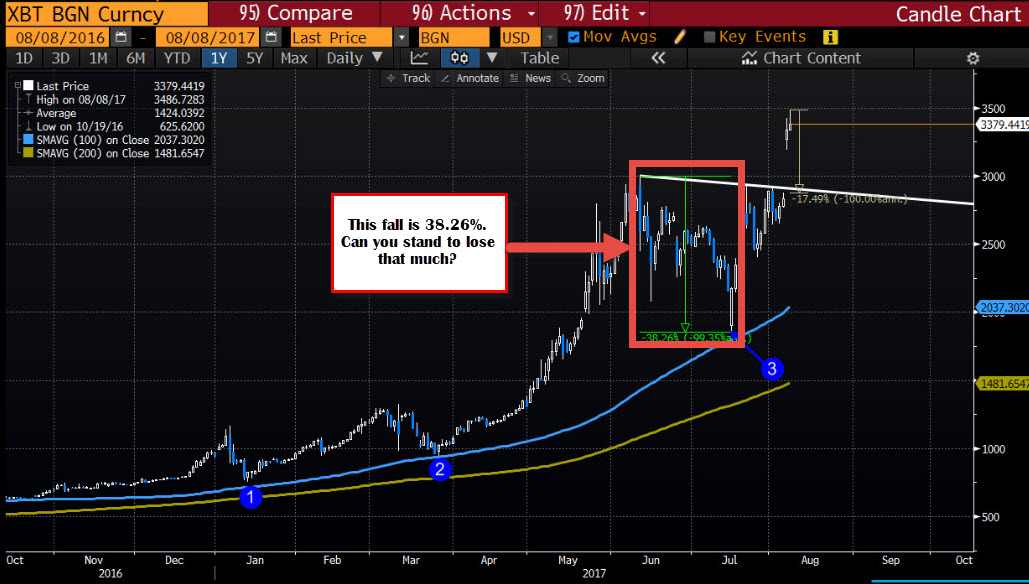
So when I see the above chart, I don't see the price move higher. I instead see the sharp move down from the June high to the July low. That decline was equal to a 38.26% decline (see chart below). That move is what you should interest you the most. The wins will take care of themselves. It is the huge losses that kill traders for ever and ever.
How can you control your risks in an instrument like Bitcoin?
So the question becomes "How and can you control your risk in a product like bitcoin that has the potential to move 30% or more?"
My answer is to rely on technical tools that can define a bullish or bearish bias and also define risk.
Now the next question is: "Are technicals effective in defining a bias and risk in bitcoin, the way they are in a currency pair like the EURUSD or USDJPY?"
I believe that instruments - like bitcoin - that trade with ample liquidity, will always be charted by those traders who are concerned about what they can lose. Those traders use technical tools so they can not only get in at a low risk, but more importantly, get out if wrong (or to take profit).
How do you know if traders are using technicals in an instrument you trade (like bitcoin)? The simple answer is by looking at the price action and seeing if the market reacts to a technical tool/level.
For me, I rely on
- Trend lines
- The 100 and 200 bar MA and
- Retracements.
If the price reacts to those tools, I start believing there is a future in trading even the highest flying instrument (with care of course).
Below is the hourly chart of bitcoin from the end of May to the high of $3000 that stalled the rally and ultimately led to the 38% drop. The blue line is the 100 hour MA, and the green bar is the 200 hour MA.

What do you notice?
What I notice on the left side of the chart above, is that if you are looking to buy bitcoin (which most people are), the green circles are places where the bias and risk can defined.
At the first green circle the price moves above the 100 and 200 hour MA. The bias turns bullish from bearish. Risk can be defined against the area as well. If you bought on the break above, you want to see the price move higher. You don't want to see a move back below the MA lines. If it did, you would get out. The price did indeed move higher.
At the 2nd green circle on June 1, the correction moved down and retested the 200 hour MA (green line) and held support again. Although at a low, as long as the price stays above the MA line, the bias is bullish. If the price moves below, you would want to get out. That combination of defining bias and risk makes that level a great place to buy.
What the picture (chart) shows me, is that traders used technicals to define the bias, and define risk in bitcoin. The buyers that leaned against the 200 hour MA were rewarded with a great trade location. That is what you want to see on any instrument you may trade. You want to see the price reaction to a key technical level, like the 200 hour MA and go your way. However, if it does not go your way, that is ok. You only lose a little.
So what happened in this trade?
Over the next three days (see green numbered circles), the price trended from $2320 (by the green circles) to $2938 on June 6th (green circle 3). That is a $600 move, or 26% gain in 3 days. That beats the Nasdaq.
However the important thing to realize is you need to know what you are doing. You need to define your risk. You need to correctly define the bias. In this case, the 200 hour MA could have gotten you in the trade, near the lows. The only thing you had to do was not get out, and ride the trend until the price action and tools told you to get out.
So , when do you get out? When does the market tell you, the trade is all over?
Technicals can get you in. Technicals can get you out - even in bitcoin.
Below is the 5 minute chart of the sharp run up. I use the 5-minute chart because the $600 move higher, is racing away from technical levels on the hourly chart.
However on the 5-minute chart, the 100 and 200 bar MAs are also able to define a bias and also define risk.

Looking at the 5 minute chart, the low on June 1st was where the price was testing the 200 hour MA. Although the price was still below the 100 and 200 bar MA on 5-minute chart, the risk was the 200 hour MA on the hourly chart. The MAs on the 5-minute were targets to get to and through to confirm the low was in place.
So what happened?
The price moved higher from that low, and caught up with the 100 and 200 bar MAs before gaping higher op June 5th (see chart above).
On the break higher, the price kept on finding support against the 100 hour MA (see blue numbered circles in the chart above). The price based one final time against the 100 bar MA at blue circle 5, and the price took off.
Did the technicals show the bullish way? You bet.
At blue circle 6 there was a final test that propelled the pair to the $2938.50 high. From there the price started to correct, with the first fall taking the price back below the 100 bar MA (blue line). That is bearish and a logical place to exit the long trade. Then a little later the 200 bar MA was also broken. More bearish. The trade was over.
Using technicals - even in a high flying instrument like bitcoin - will give clues to traders on when to get in, when to stay in, and when to get out. Use them to define your risk. Use them to define the bullish or bearish bias. It is the only way - especially when dealing with risky instruments like bitcoin.
What about now?
So what is the bitcoin telling me now from a technical perspective?
Well, looking at the hourly chart below, the price gapped higher over the weekend and moved to an all time high of $3486.72. In the process, bitcoin price moved well away from the 100 and 200 hour MA. Like the prior example, it is time to go to the 5 minute chart for bias and trading clues.

Looking at the 5-minute chart below, the price has started to trade above and below the 100 and 200 bar MAs today. Buyers and sellers are fighting it out with no clear winner as the market price chops around the MA lines.
The 100 bar MA comes in at 3399.63 currently. It will now take a move below that MA to turn the bias back to the downside. If not the buyers/bulls are still in control.
It is as simple as that. Follow the technicals, they will tell you the real story you want to hear.

SUMMARY:
Bitcoin can be a complicated instrument, with a complicated story line.
However, if you can sift through the stories (and put them aside) and instead focus on the technicals and the clues from the technicals, you will start to better define the bullish or bearish bias, and more importantly the risk.
It is the risk that is most important for successful trading. If the risk is defined and limited and you are not stopped out, you can enjoy some nice runs without too much stress or fear.
Remember, the price action does not lie. It tells the real story of the buyers and sellers. Applying the technical tools give you the levels to lean against to define bias and risk. That is the name of the game in all traded instruments - even high flyers like bitcoin.

