
200 week MA at 88.388 and 100 bar MA at 88.256 challenges the sellers.
The AUDJPY traded to the highest level for the year and since December 2015 last week.
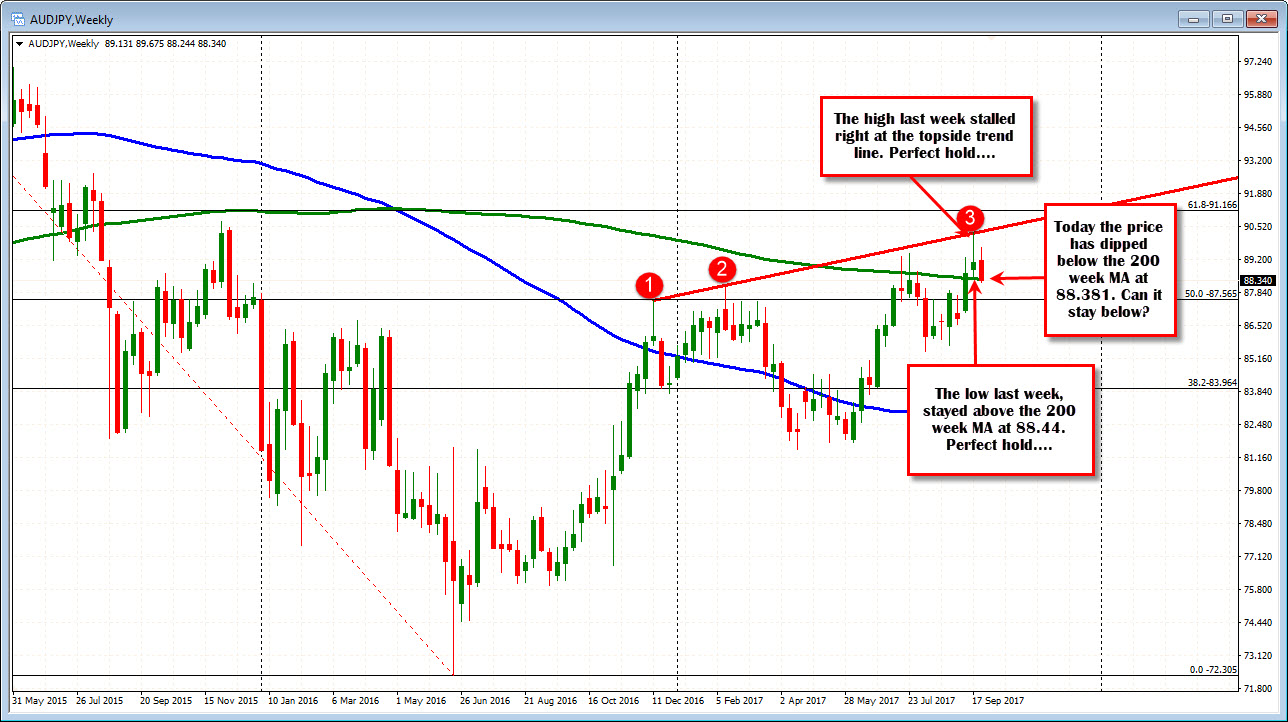
Last week's trading range found support at the 200 week MA (green line in the chart above) at 88.406. The low price last week stalled at 88.44. That was a perfect technical hold.
The high price last week reached 90.29. A topside trend cut across at 90.307 (red circle 3 in the chart above). That was a perfect technical hold.
The highs and lows were about as techincal as you can get - moving average holds below. Trend line hold above. Perfect.
What about this week? What's next?
We are into the 2nd day of the week and the price is back down testing that 200 week MA at 88.388 (it is a few pips lower from last week). The test is not as perfect as last week. The low extended to 88.256 today. So there has been a dip below the key MA level. We currently trade just below the MA level.
Drilling down to the 4-hour chart below, the fall today stalled right against the 100 bar MA on that chart (blue line in the chart below). That MA comes in currently at 88.256. The low today was at 88.244 - the MA was a pip lower on the last bar at 88.246. Perfect hold
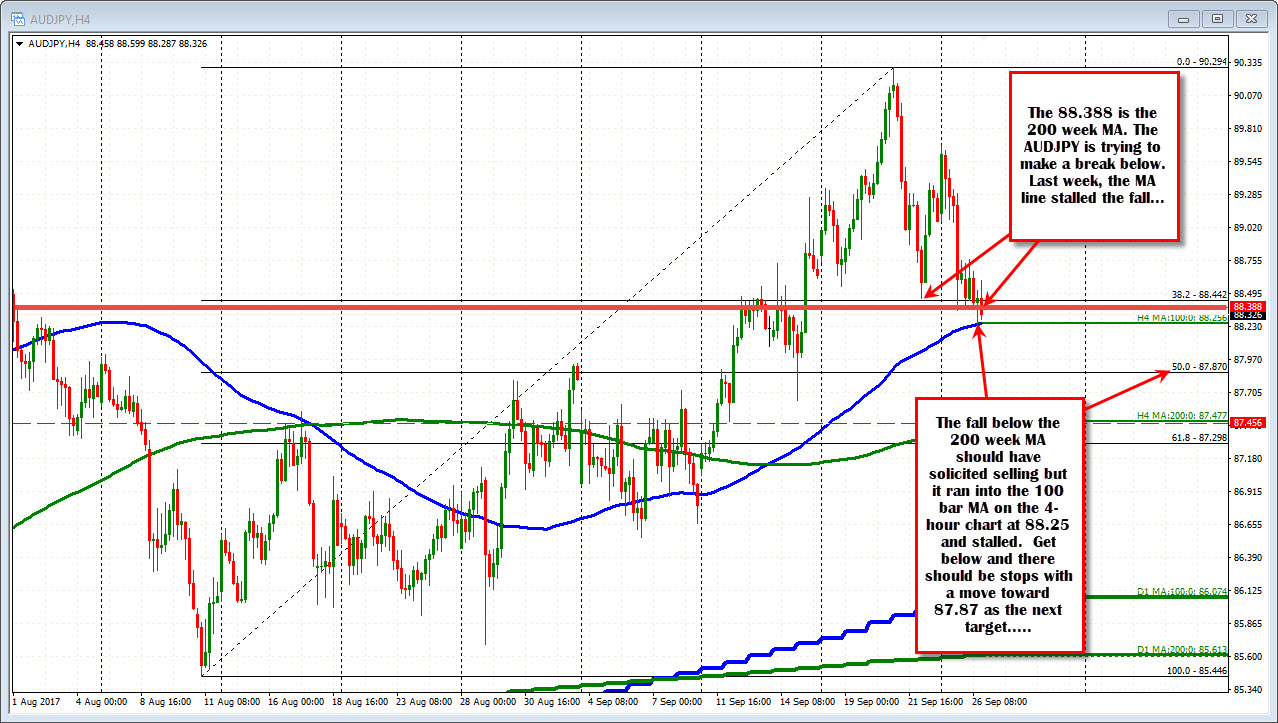
So the pair is down on the week and threatening to dip back below the key 200 week MA. However, it will need to get another push lower below that 100 bar MA on the 4-hour to turn the tide more bearish. That level is setting up as a tough nut to crack as buyers stalled the fall against the level on the first look.
Will the buyers be able to hold the line on another test? If they do, we can expect a move back above the 200 week MA, and could see a greater rotation higher/
However, on the downside if the support MA is broken, look for stops triggered and a further run lower. The next target comes in at 87.87. That is the 50% of the move up from the August low (see 4-hour below).
A break lower would also make the price action on the weekly chart, more bearish with two closes above the MA, a test of the topside trend line holding and a failure back below the 200 week MA making for a more bearish technical picture and price action story.
So a key area is being tested right now. What happens here will determine the bullish/bearish bias going forward

