
Moved above 200 day MA for the first times since October 2013 yesterday, but back below today
The EURGBP has turned the ship back around in trading today after 4 straight days of buying.
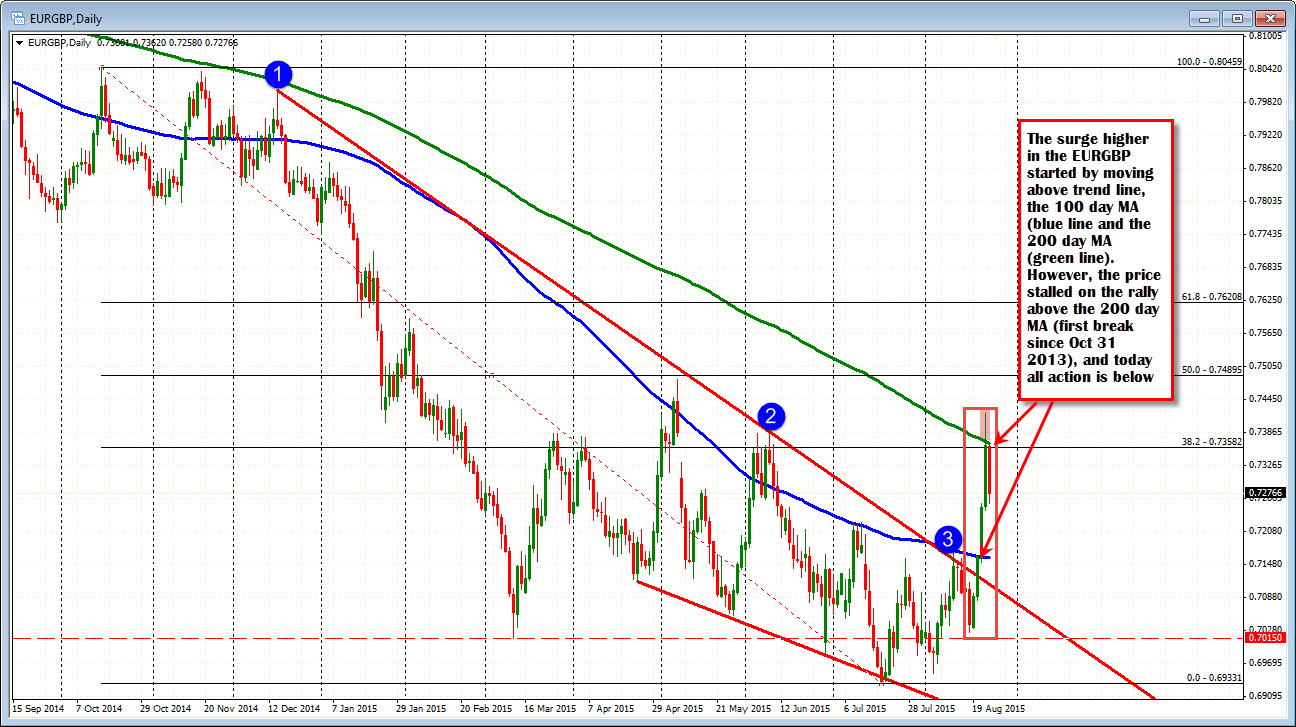
Overall before the last surge higher, the pair has been under pressure as common trading wisdom had the BOE following the Fed in the tightening cycle (generally speaking). That idea took a hit as stocks started their tumble and traders rethought ideas of tightening. The subsequent surge higher saw the price move above the 200 day MA for the first time since October 31, 2013 (yes 2013). That move was short lived. The pair closed below that MA line (at 0.73667) yesterday. The high today reached 0.7362. The ship turned around - and rather quickly.
Is the upside done? Well, the stock markets might have a say. Traders get used to trading correlation stories that controlled the market in the recent past - especially when that trade was particularly harsh. But the crowded short EURGBP trade, may also have gotten less crowded as traders were stopped out on the surge higher. So rallies in EURGBP on stock sell-offs in the near term will be eyed for signs that the market is done with the rally idea.
What levels technically can be eyed for clues?
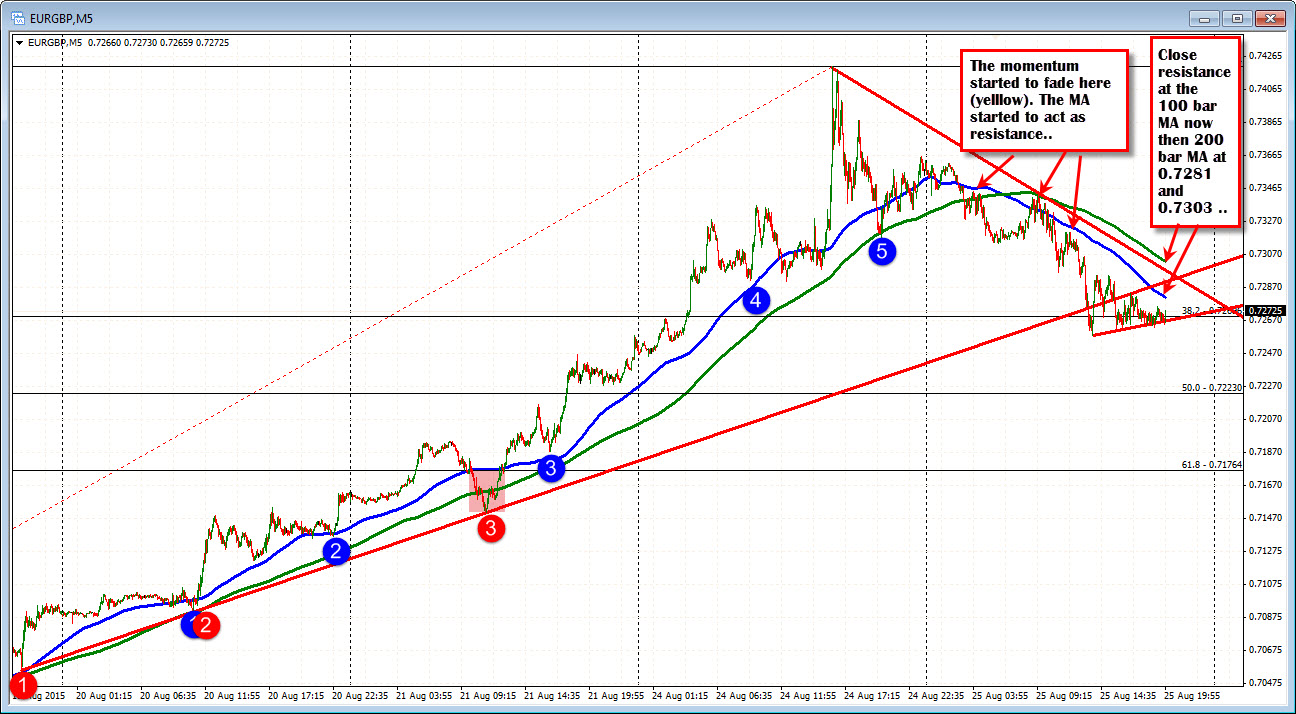
Looking at the compressed 5 minute chart below, note the corrective moves on the way higher. On each correction, either the 100 bar MA (the blue line), the 200 bar MA (green bar) or the upward trend line held support on the dips. (do you SEE the pattern?)
That pattern was reversed in trading today. Instead of finding support, the corrections found resistance against the MA levels. So sellers are starting to take back more control.
Are the sellers sitting on top of the longs and forcing them to scream "Uncle"? Not so fast. The pair has stalled over the last 7 or so hours trading above and below the 38.2% of the surge higher (at 0.7269). This has allowed the 100 bar MA (blue line) to catch up with the price. The MA is currently at 0.7281 (and moving lower). The market is compressing and traders will need to make up their minds.
.
So back to the stocks...The stock market may be what traders will keep an eye on, but so too will be those MAs (you can throw in the trend lines as well). With uncertainly elevated from a central bank perspective, that idea argues for a trading/up and down market. In which case, the MA lines will be points to define and limit risk (i.e.., move above bullish/move below bearish)
However if the storm blows and the stories of yesterday (i.e. last week) reestablish themselves, the less crowded short trade in the EURGBP, might restart getting crowded again. In which case look for sellers against the MAs and a clean break below the 38.2% retracement to signal all is over with the correction and the peek above the 200 day MA was just that....a peek at a peak.

