
Looking back toward the 100 hour MA
The EURUSD is trading at session highs, following in the footsteps of the GBPUSD (but at a slower pace).
The pair is trading at 1.1871 up about 24 pips from the close. The low reached 1.1847.
Looking at the hourly chart above, the price is trading above swing levels in the 1.1856-60 area The swing high from November 15 and then again on November 23/24 were broken on November 27th on the want to the recent high at 1.19605.
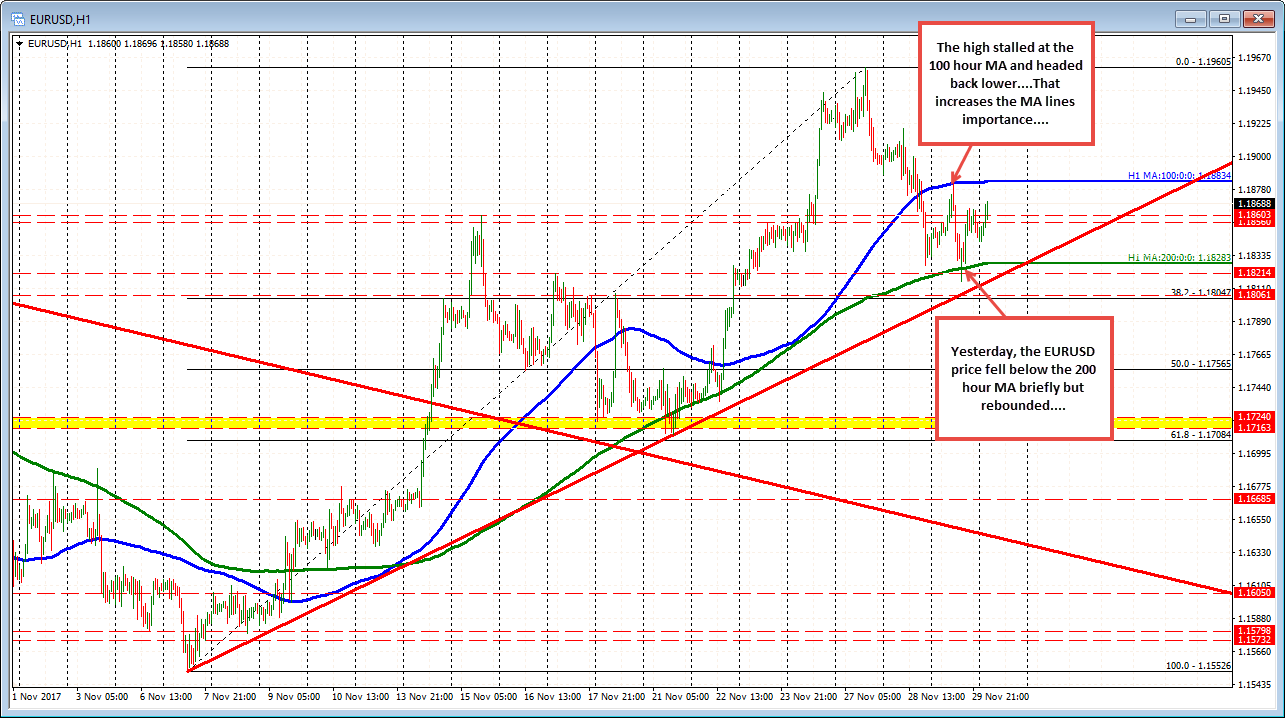
On Tuesday this week, the price moved back below that area and the 100 hour MA in the process (blue line). That 100 hour MA was also important yesterday when on the correction higher, the price stalled right against that MA line (blue line above). Holding below that level gave sellers to go ahead to push the price back lower. The low did breach the 200 hour MA (green line) but only for a brief moment.
The ups and downs continued and we are back above the swing levels at 1.1856-60 level. Ahead, is the same 100 hour MA at 1.18834. A test of that MA should solicit some selling with stops on a break.
Overall, the trading market for this pair is defined by the two MAs - the 100 hour MA above at 1.18835 attracts sellers. The 200 hour MA below at 1.18278 attacts the buyers. Both can define and limit risk on trades.
As a result, as the trading progresses today, traders will be looking at those levels for break out triggers.
Between the two sits the old swing level which may be a barometer for bullish or bearish as the market figures out the next move. Right now the bulls are trying to make a play but the key MA above looms large as a hurdle to get to and through.

