Tests 200 day MA today and backs off
The GBPCAD has run higher with the post BOE rally AND the slow grind lower in the CAD of late. The combination sent the GBPCAD through a broken trend line and above the 38.2% of the move down from the 2017 high at 1.66063 (see chart below).
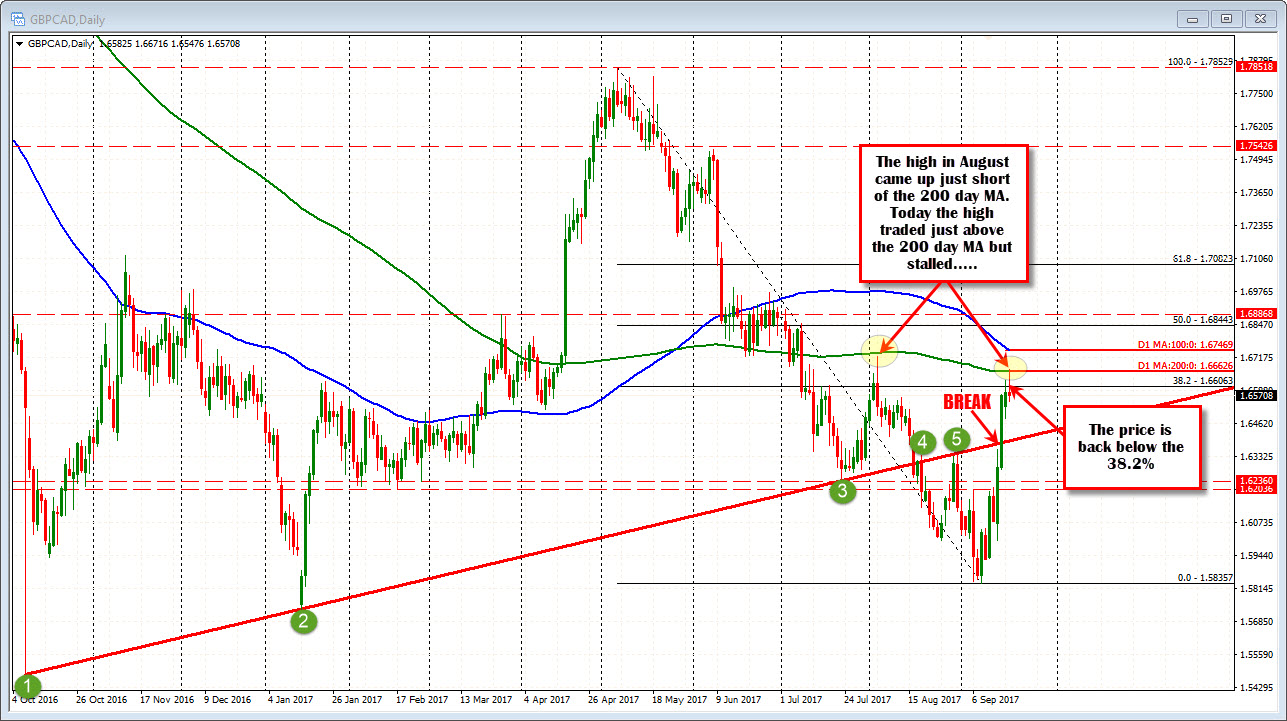
Today, the pair traded at the highest level since August 3rd. Back on that date, the price tested the 200 day MA and turned around. Today the price in the GBPCAD retested that 200 day MA at 1.66626 (the high reached 1.6671). The inability to extend higher, has seen some profit taking. The price trades back below the 38.2% retracement at 1.66063. That is now close risk for the sellers.
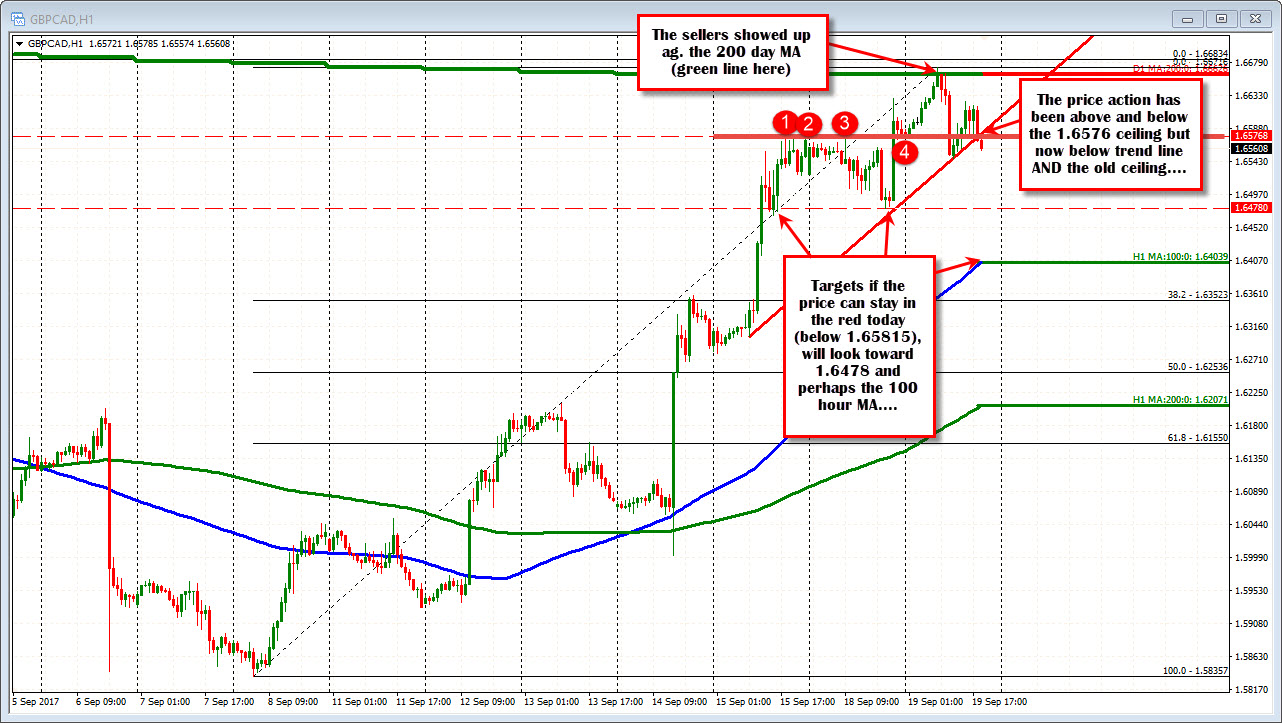
Drilling to the hourly chart, the price has just moved below a trend line and a ceiling area at 1.65768. The price is also negative on the day (closed yesterday at 1.65815). Stay in the negative for the day at 1.65815 (and mostly below the 1.65768) and the selling should increase. The low from yesterday at 1.6478 is a target. The 100 hour MA at 1.6404 (and moving higher - blue line in the chart below) is another target.