
Trend line resistance at 1.3554
The GBPUSD - like the EURUSD - has been marching higher over the last four trading days. On Wednesday the low was it 1.3366. Today, the pair moved up to a high of 1.3567. In the move higher, the price moved above the:
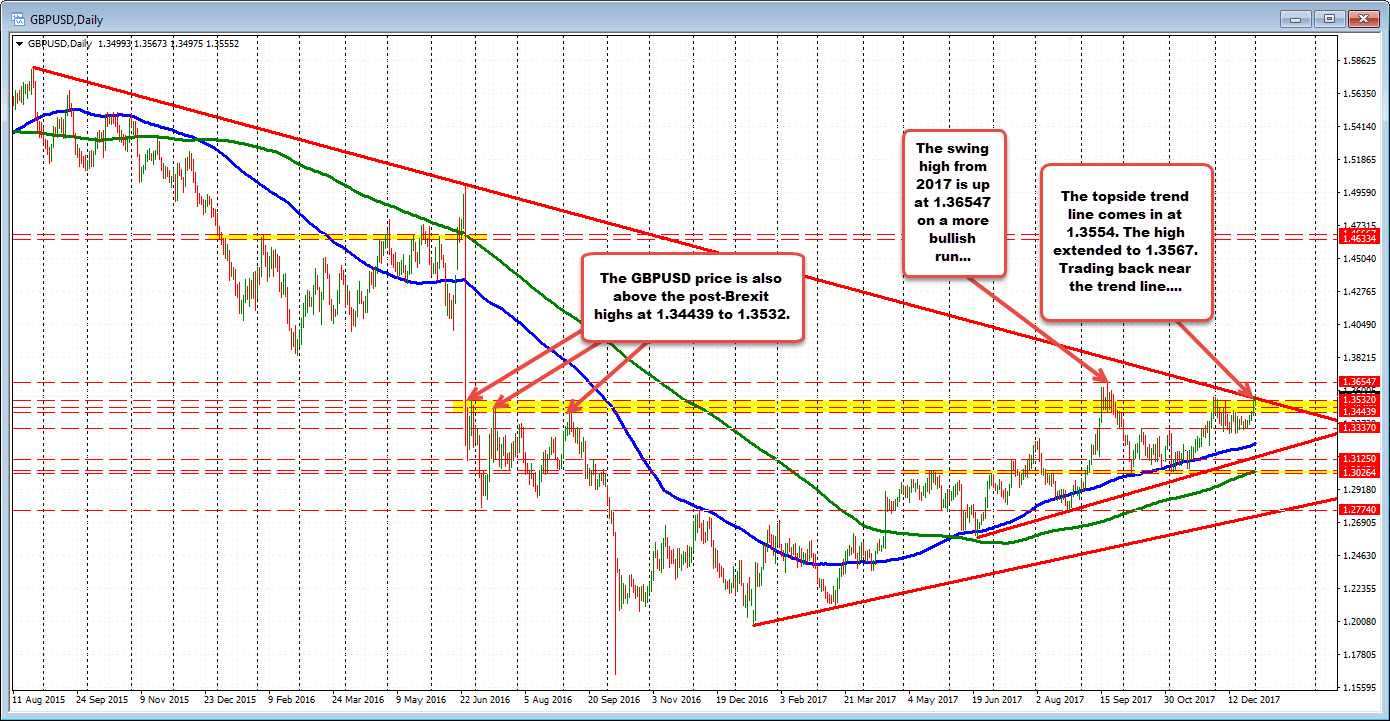
- Swing highs from the post-Brexit correction in 2016 at 1.34439 to 1.3552 (see daily chart below). Stay above the 1.3532 will be a risk level for longs today.
- A topside trend line at 1.3554 (see daily chart below).
The high price extended to 1.3562 and has backed off, but not by much. The pair trades around the 1.3554 level currently. On the topside, if the price can keep the momentum going, the high price from 2017 comes in at 1.36547 (from September 20, 2017).
Drilling to the intraday 5-minute chart below, the price action has been consolidating above and below the 1.3554 level (see green slashed line). That is the trend line on the daily chart). The consolidation has allowed the 100 bar MA to catch up to the price. That MA comes in at 1.3546 currently. The price based against that MA earlier in the day. A move below would be a bearish development intraday. The 1.3539 is also a level to get back below and the aforementioned 1.3532. That progression would weaken the bullish run today.
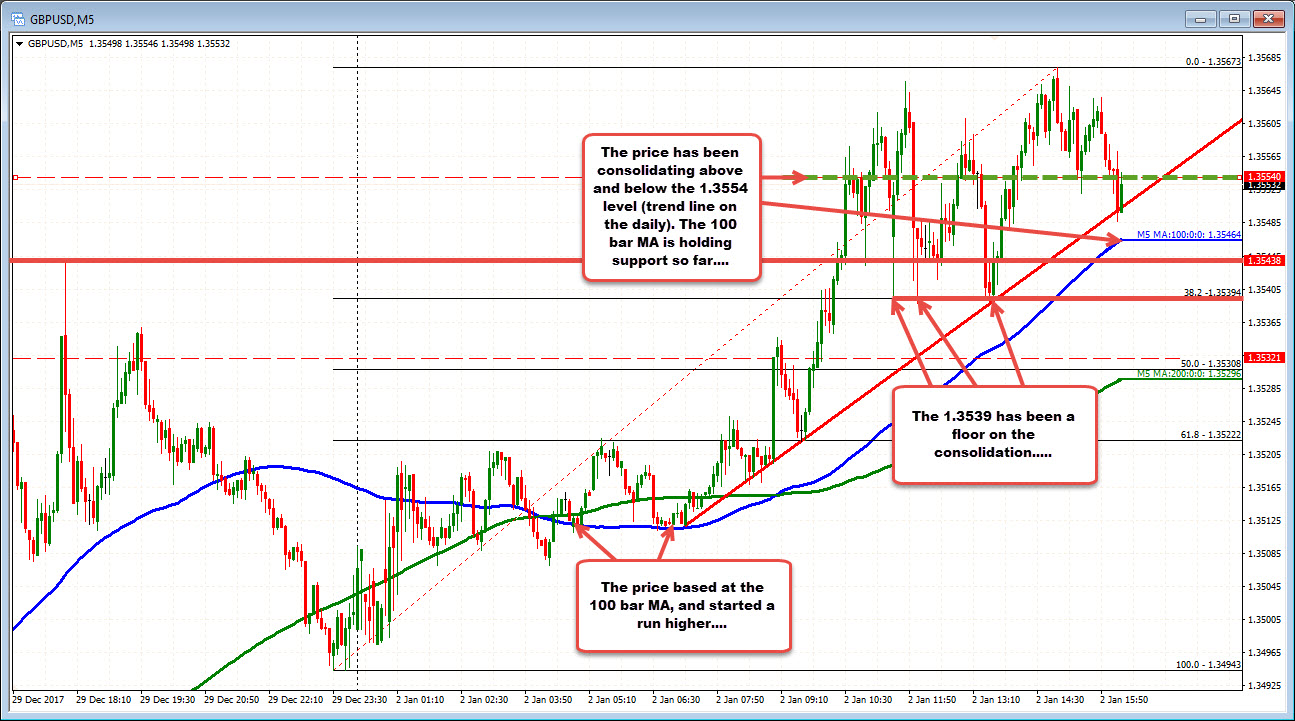
Until then, the buyers are more in control, but need to get and stay above the 1.3554 trend line level. Do that and the sellers - looking for a correction after the recent run up - will be feeling some pain.

