
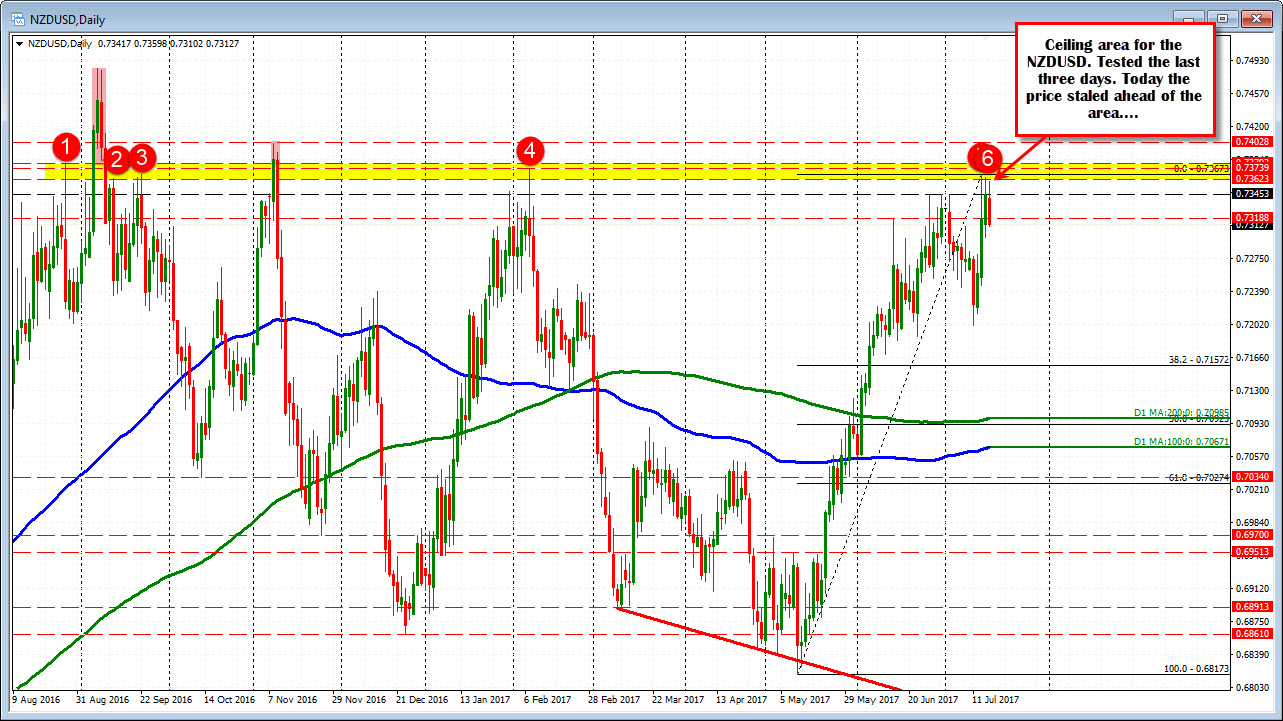
0.7362-79 remains a ceiling area for the pair. Levels to eye through CPI in the new day.
The NZDUSD rallied last week into a resistance area defined by swing highs going back to August 2016. That area comes in between 0.7362 and 0.7379 (see red number circles in the chart below). There have been four days since that time when the price closed above on extensions. Three were in September 2016 and one in November 2016. The pair revisited the level in February 2017 when the high for the year was reached at 0.7373 (that is the high for the year). The high last week stalled at 0.73673 - less than 6 pips shy of the 2017 high.
Today, the 3 day run higher is seeing a move back down but price action is choppy. Looking at the hourly chart below, the price is currently trading at session lows and looks toward the 38.2% retracement of the move higher from last weeks low at 0.73039. The 100 hour MA comes in at 0.7296 (and moving higher). The low from Friday stalled at 0.7298 -just above the 100 hour MA. That area (from 0.7296 to 0.73039) will test the sellers strength on a test. There are a number of reasons (see blue circles as well as the 38.2% and 100 hour MA) to expect buyers to lean against the area on a test today, with stops on a break below.
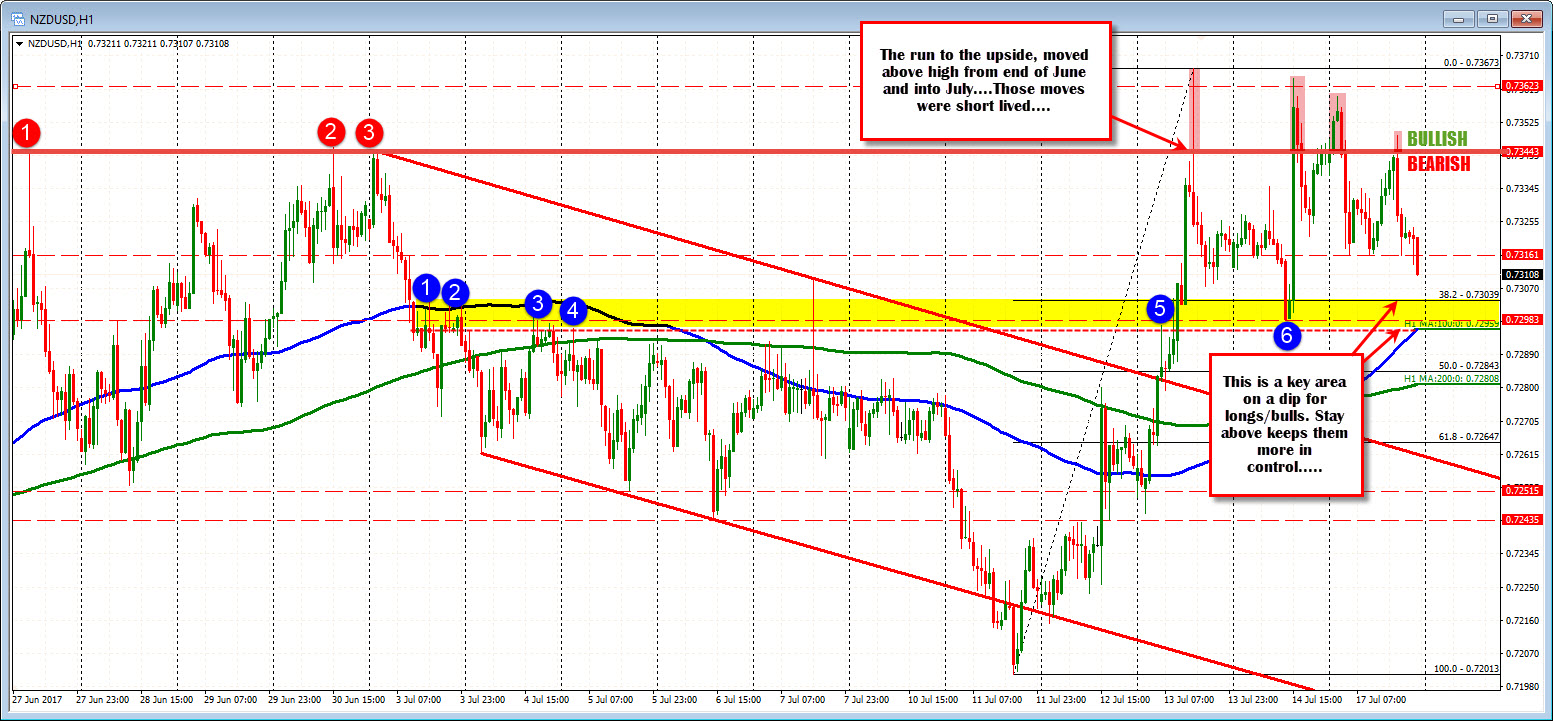
Perhaps giving the pair the needed shove, will be the 2Q CPI which will be released at 6:45 PM ET/2245 GMT. The expectation is for a rise or 0.2% vs 1.0% gain in the 1Q. The YoY is expected to dip to 1.9% from 2.2% last month. That release could have a major impact on the bullish or bearish bias in the new trading day. Risk is also increased. So you may want to wait and play a break - either above the 0.7344, with an eye toward getting above the 0.7362-79 area, OR play the break of the 100 hour MA at 0.7296. Let the data decide and the price action against the technical levels in play.

