The 114.289 – 114.49 is a key ceiling area to get to and through
The USDJPY has been trading above and below a topside trendline connecting the high from March to the high from July. That trendline cuts across at 113.65. Stay above that level is more bullish for the pair.
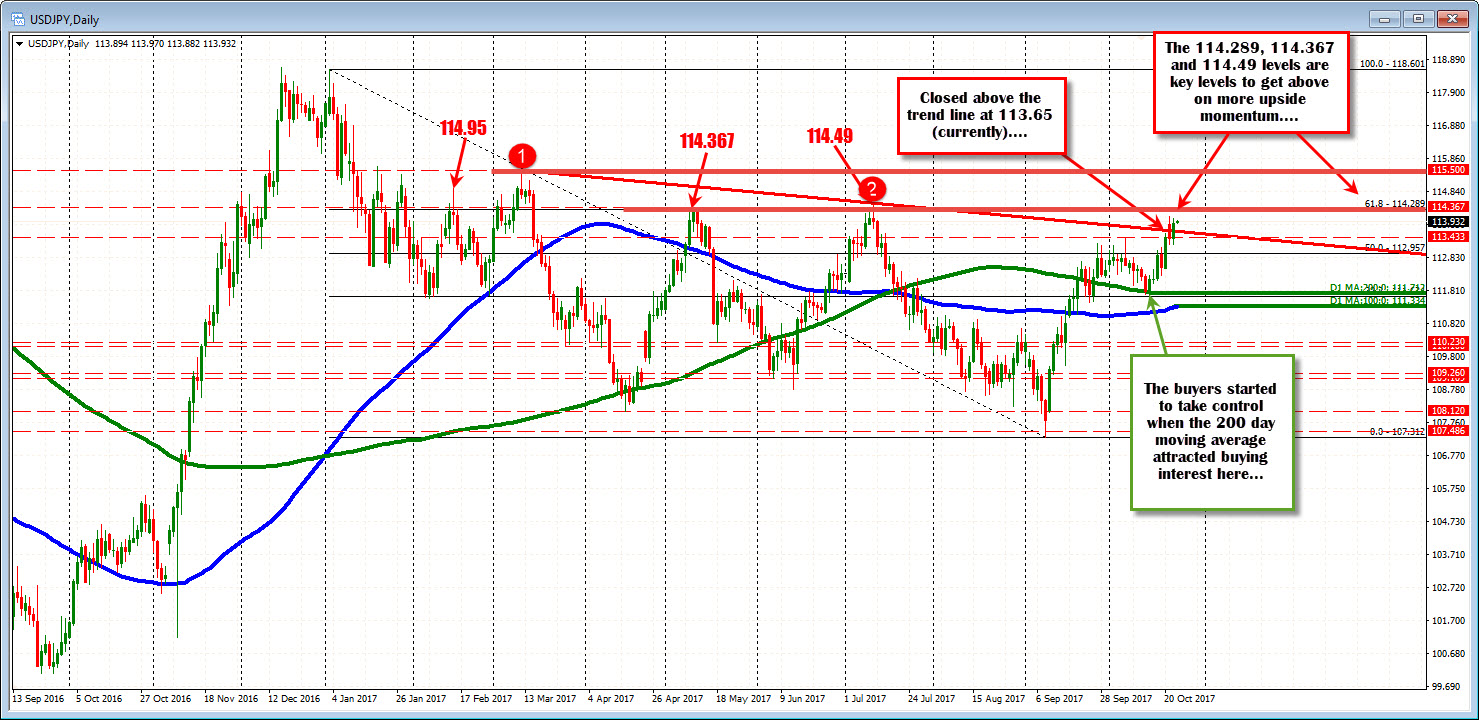
Looking at the daily chart, swing highs from May at 114.367 and July at 114.49 are joined by the 61.8% retracement of the move down from the January 2017 high at 114.289, to form a key resistance target between the levels (from 114.29-49). If the price in the new trading day is able to stay above the broken trend line at 113.65, traders will start to look toward that area. Get above it, and it opens a door for further upside potential with the February high of 114.95 and the March high at 115.50 as the next key upside targets.
If the price should move back below the trend line, and then the early October high of 113.43, that would disappoint the buyers and likely lead to further momentum selling lower.
That is the look from the daily chart.
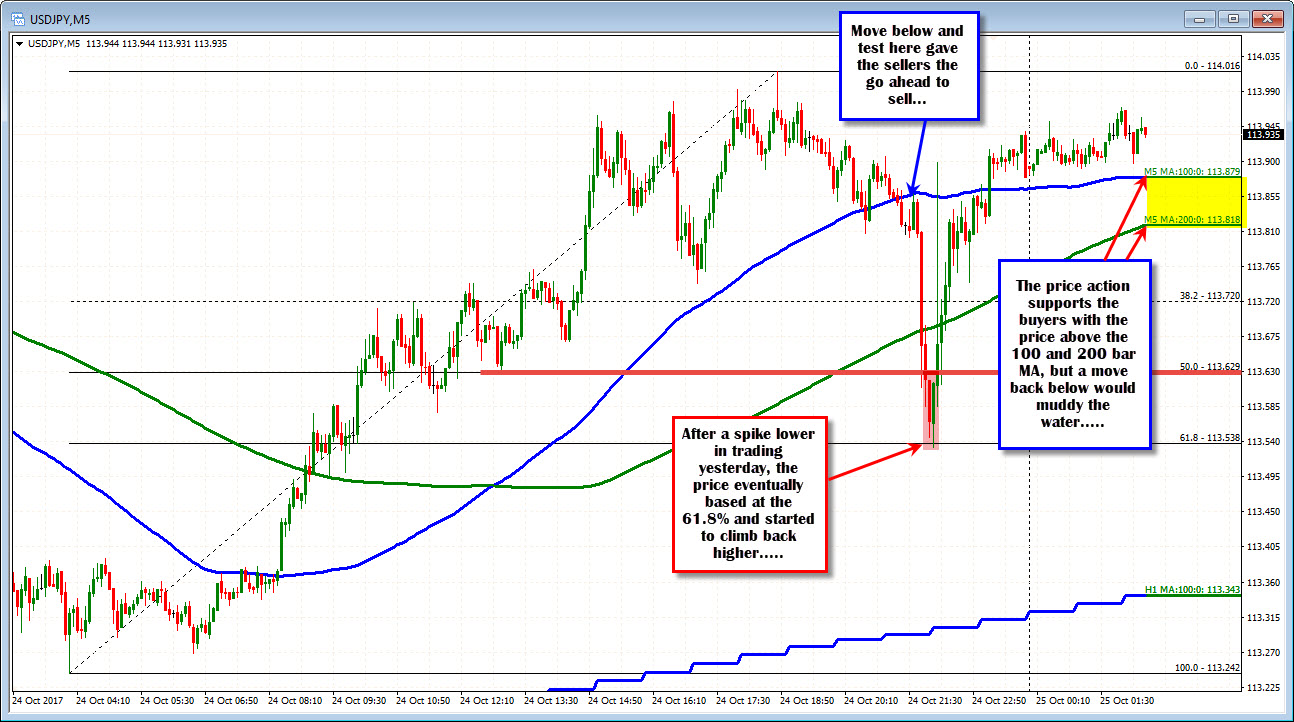
Drilling to the price action from the 5-minute chart, the picture is not so bullishly convincing. Looking at the chart below, the price action in the NY session saw the price crack below the 100 bar MA (blue line), retest it, and then sell off hard (to the low at 113.53).
The price fall did not stop until breaking below the 200 bar MA (green line in the chart below), the 50% at 111.629, and stalling at the 61.8% retracement level at 113.538.
From there, the price volatility took the price up and down but there was a more steady move higher into the NY afternoon session.
By the end of the day, the price had moved back above the 100 bar MA (blue line) and it has remained above that MA level since.....Buyers are more in control.
What now?
With the up and down volatility, I would be cautiously bullish. Yes, the price is above the trend line on the daily, and yes, the price is above the 100 and 200 bar MA (blue and green lines) on the shorter term chart, but that volatility from yesterday shows buyers can be fickle.
So on a move below the 100 and 200 bar MAs at 113.818-879, the bullish waters will become more muddy (could reverse the bias). Be aware. Be careful.
If the price can stay above, then there should be a run to the upside targets from the daily chart.