.... momentum slows. Back below the MA target.
The BOJ kept policy unchanges, increased growth projections but lowered inflation expectations.
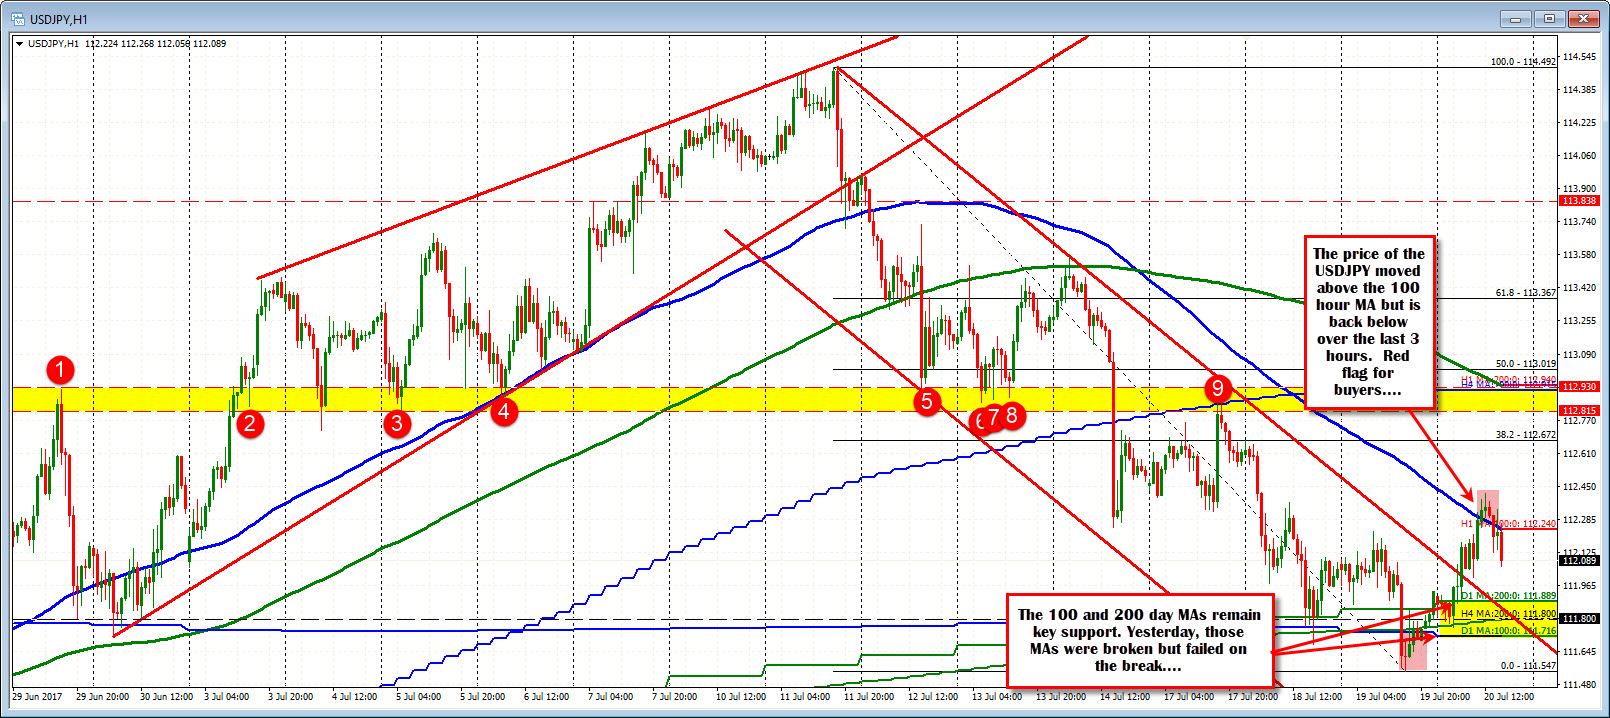
The USDJPY moved higher before the release and extended above its 100 hour MA (blue line in the chart above) after the release. However, we have now seen the price comes back down below the 100 hour MA at 112.24. The last three hourly bars have closed below the MA line. That raises a red flag for the dip buyers.
Looking back, the price moved below the 100 hour MA on July 12th and has remained below the MA since that time. The move above today was the first look since then. The next targets at the 38.2% retracement at 112.67 and the key resistance at the 112.81-93 (see yellow area and the red circles in the chart above) were not closely tested. Yes... we are higher but buyers had a shot to take it higher above the 100 hour MA and have so far failed.
Although the red flags are up on the hourly, we still have to be aware that yesterday the break of the 100 and 200 day MAs yesterday also failed. That too is a red flag, but for the sellers. The 200 and 100 day MAs come in at 111.889 and 110.716 respectively.
So technically a battle rages with failures on either side with resistance now against the 100 hour MA (at 112.24), and support at the 200 day MA and then 100 day MA (111.889 and 111.716)
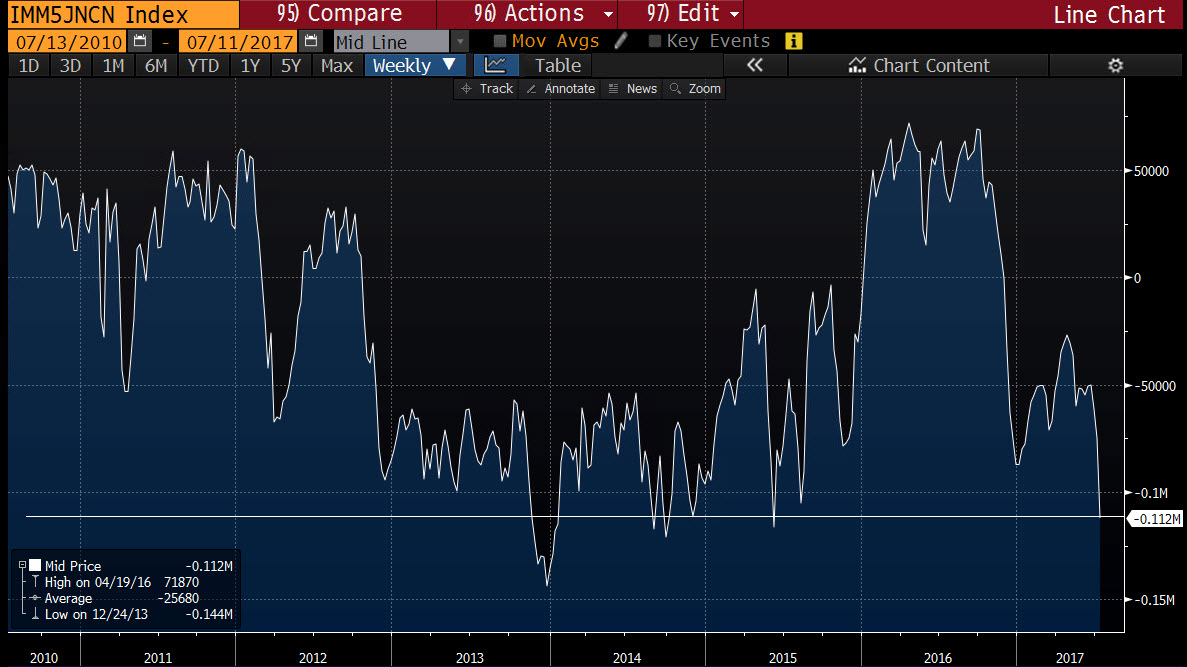
PS Remember, the most recent commitment of traders report from the CFTC showed shorts in the JPY at -112K. That is a pretty hefty short (largest since mid year 2015 - see chart below).
That could help to keep a lid on the pair as the shorts in the JPY, feel the pain from the what has been a stronger JPY over the last 7 trading days (lower USDJPY = stronger JPY).