Stocks lower leading to flight into the JPY
The German Dax is down -1%. The France CAC is down -0.8%. The UK FTSE is down -0.6%. IN the US, the pre-market trading shows lower levels with the Nasdaq down -47 points. That more than erases the 21 point rise yesterday (+0.32%). Yields on debt are unchanged to a bit higher in the US.
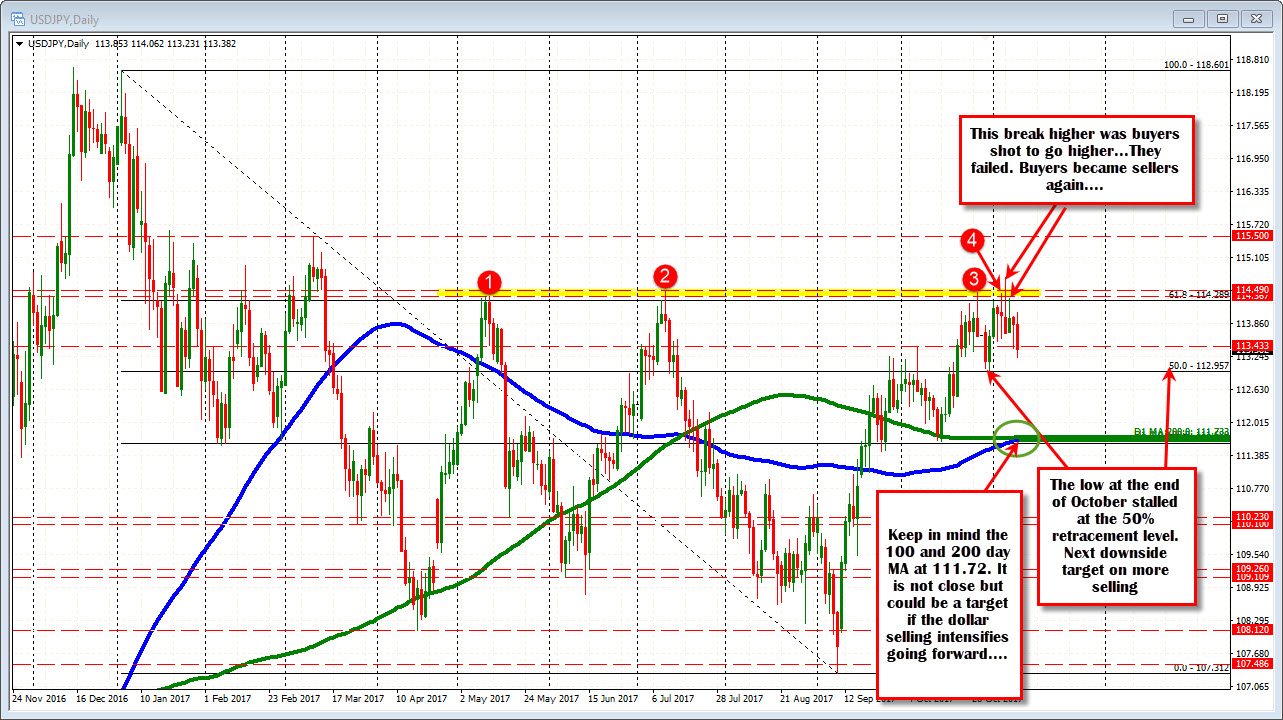
Looking at the daily chart, the pair traded to the lowest level in November and in the process, is moving away from the failed break of the quadruple top from last Friday's trading.
That break higher (see yellow area in the chart above) was the opportunity for buyers to take more control technically. That failed.
The market has chopped around since then, but the high this week (from Monday) stayed below the ceiling area from 114.39-49 (high Monday reached 114.334).
The next key target on the downside from the daily chart comes in at the 50% of the 2017 high to low trading range at 112.957. At the end of October, the price based against that level before pushing higher (see chart above).
It is a ways away but also take note of the 100 and 200 day MAs at 111.72 area. They are sitting on top of each other and could be a target if dollar selling intensifies.
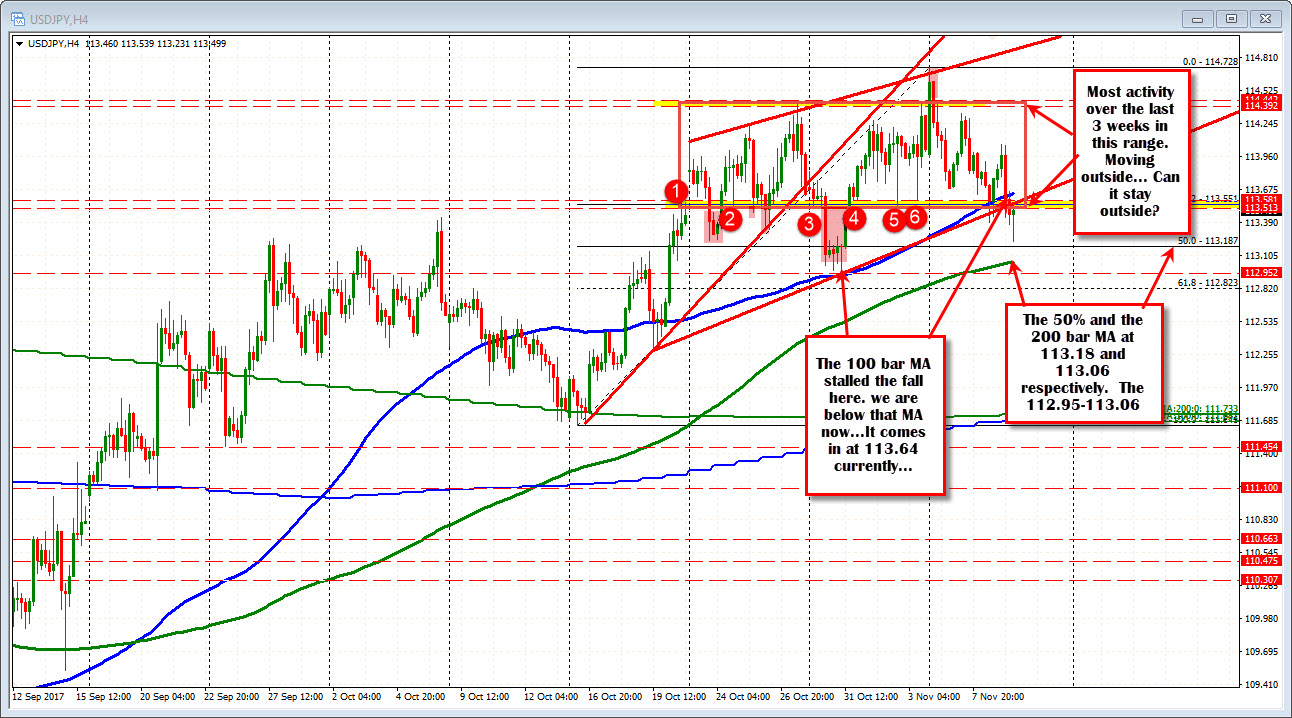
Drilling to the 4-hour chart below, the pair has move below a swing area in the 113.513-55 area. The price has traded mostly above that area over the last 3 weeks of trading. Admittedly, there have been pushes lower. The biggest of which stalled at the 100 bar MA on the 4-hour chart (see blue line).
Yesterday and today, we moved below that 4-hour MA line (see blue line in the chart below). Yesterday the break failed. Can we stay below today? That will be eyed by shorts today (the line comes in at 113.64.
As I type, the price is rebounding off the lows and tests the yellow floor area. Key test for the sellers. Keep a lid on it? This is the place to start to come in with stops about the 100 bar MA.