Can the sellers remain in control
The GBPAUD has been able to dip below trend line support, the 200 hour moving average (green line in the chart below at 1.9689), and what was an old ceiling (now a floor) at 1.9666.
Today's break is the first look below the 200 hour MA since February 10th when - for a brief hour or two - the MA was broken (see hourly chart below). Prior to that day, you have to go back on January 20th to find an instance where the price was below the key MA level.
Needless to say the trend higher has been quite steady. That trend is over for now with the moves below the key levels.
.
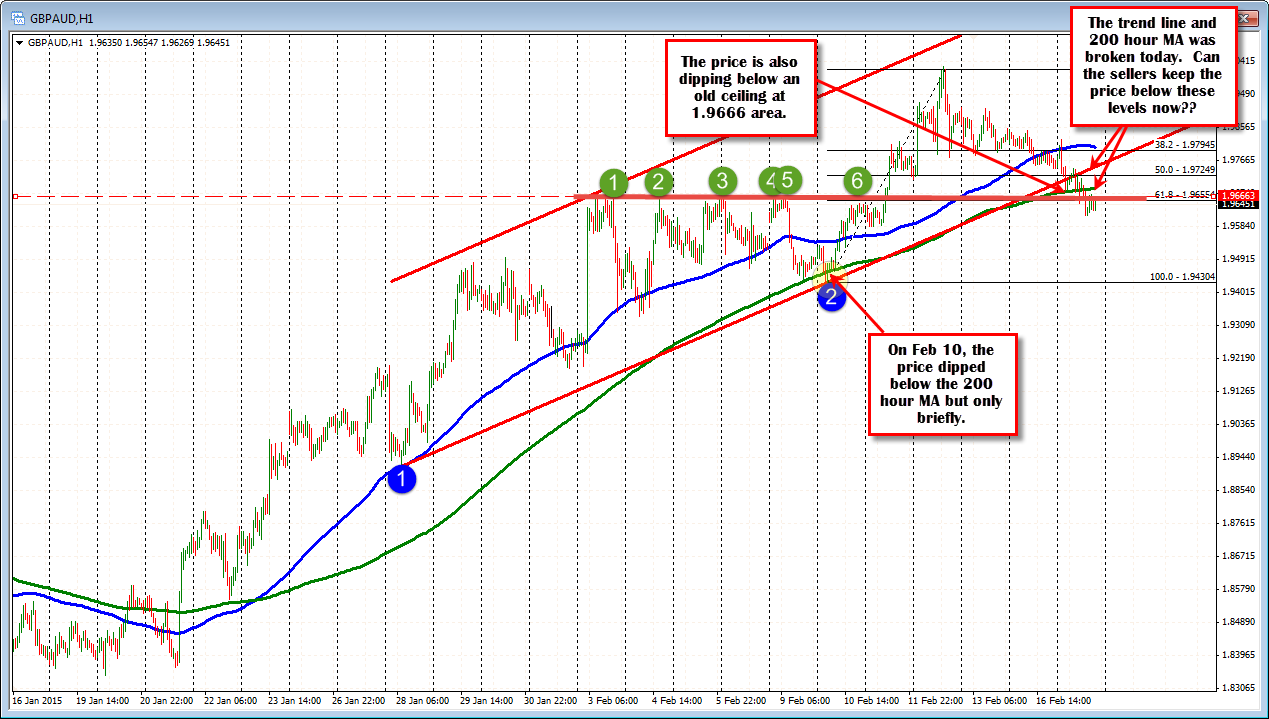
From an intermediate perspective, as long as the price remains below this key moving average (at 1.9689) and perhaps even the broken trend line at 197.49, the sellers will have more control.
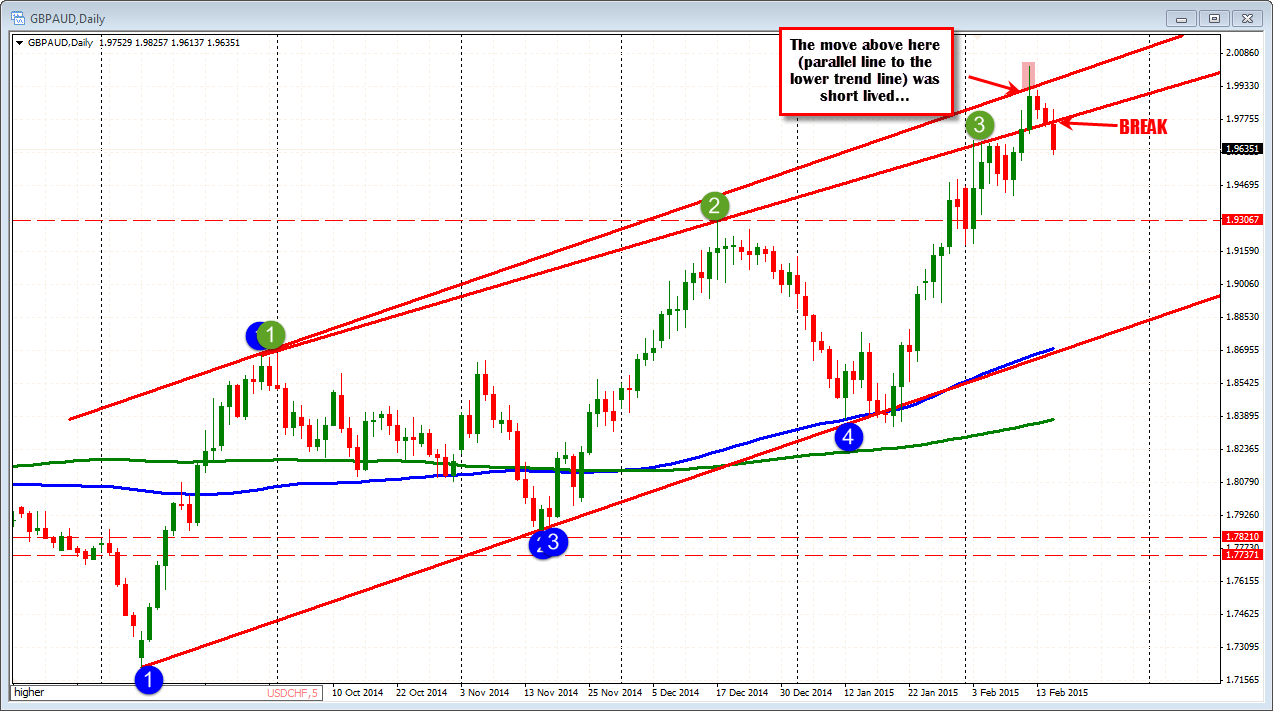
Longer-term this move is simply a corrective move from the trend higher. However, there is room to roam should the correction continue (see chart below).
What are the next downside targets? Stay below the 200 hour MA and the next targets will be the:
- 1.9583 low from Feb 11,
- the low from last week at 1.94304 and the
- high from December at the 1.93067 area (see daily chart below). .