
Last week the price fell for 5 consecutive days. This week 2 day rally followed by 3 days lower
The GBPUSD is working on its 3rd day with declines cents peaking on late Tuesday at 1.22954.
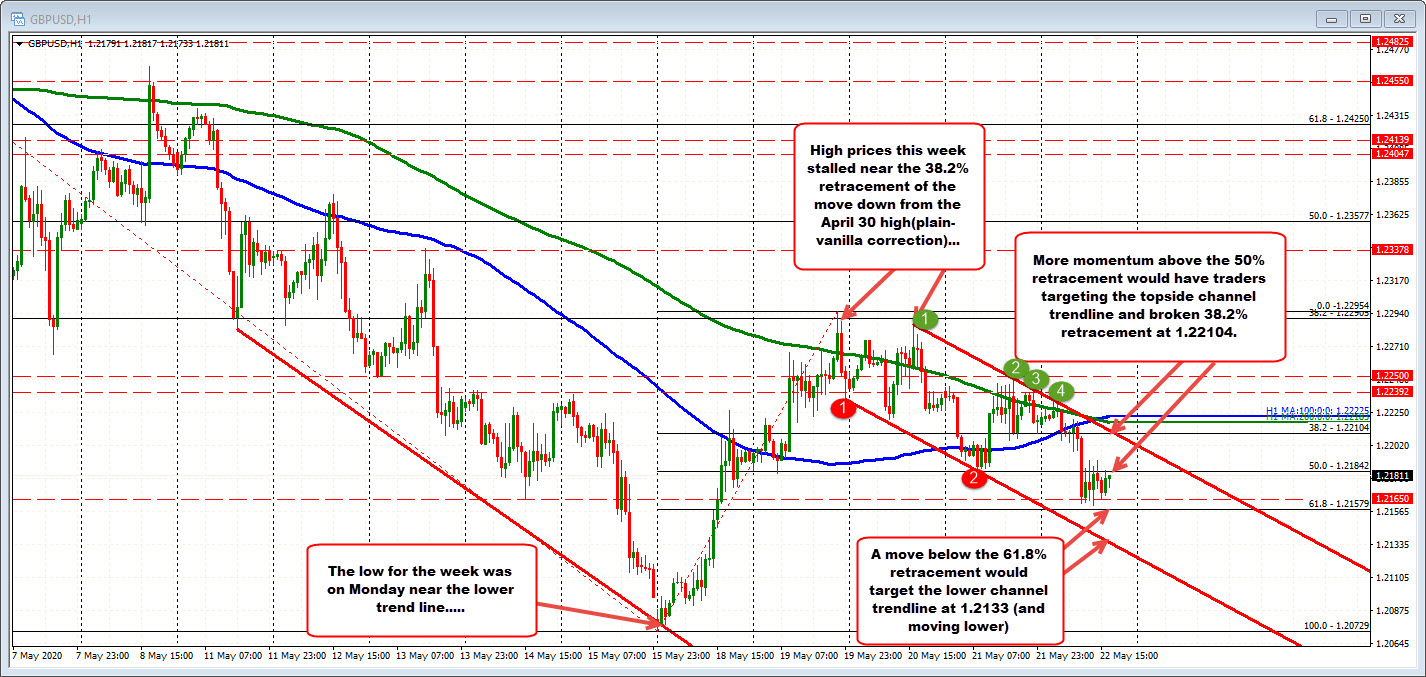
Recall that last week, the price fell for 5 consecutive days. On Monday the GBPUSD opened lower in the Asian session, but near a lower trend line. The holding of that level, helped to ignite the corrective move higher as risk-on flows dominated.
Technically, the price was able to extend above the 100 and 200 hour moving averages (blue and green lines). However, the highs on Tuesday and Wednesday started to find some selling against the 38.2% retracement of the move down from the April 30 high (at 1.22905). The inability to get above that minimum retracement level, started to paint a plain-vanilla corrective move for the pair. The selling restarted.
The price low today reached 1.2160 or 135 pips from the high. It also has been able to get below its 50% midpoint of the week's trading range at 1.21842. There has been trading above and below the 50% level over the last 7 – 8 hours of trading, but so far there has not been an hourly close back above that level (sellers holding onto more control).
On more weakness, the 61.8% retracement of the week's trading range at 1.21579 is the next target followed by a lower channel trendline currently at 1.2133 (and moving lower).
If momentum to the upside returns on a move above the 50% retracement, the broken 38.2% retracement of the week's trading range at 1.2210 is joined by a topside channel trend line. The 100 and 200 hour MAs will also be eyed. Stay below those levels keeps the trading bias tilted to the downside.

