
Just like the NZDUSD
The GBPUSD - just like the NZDUSD - rallied strongly yesterday and in the process raced up to test it's 100 day MA at 1.30388 (currently). The high price reached 1.3032 - 6 or so pips shy of the MA line. By the way, the 61.8% of the move down from the October 12 high comes in at 1.30426.
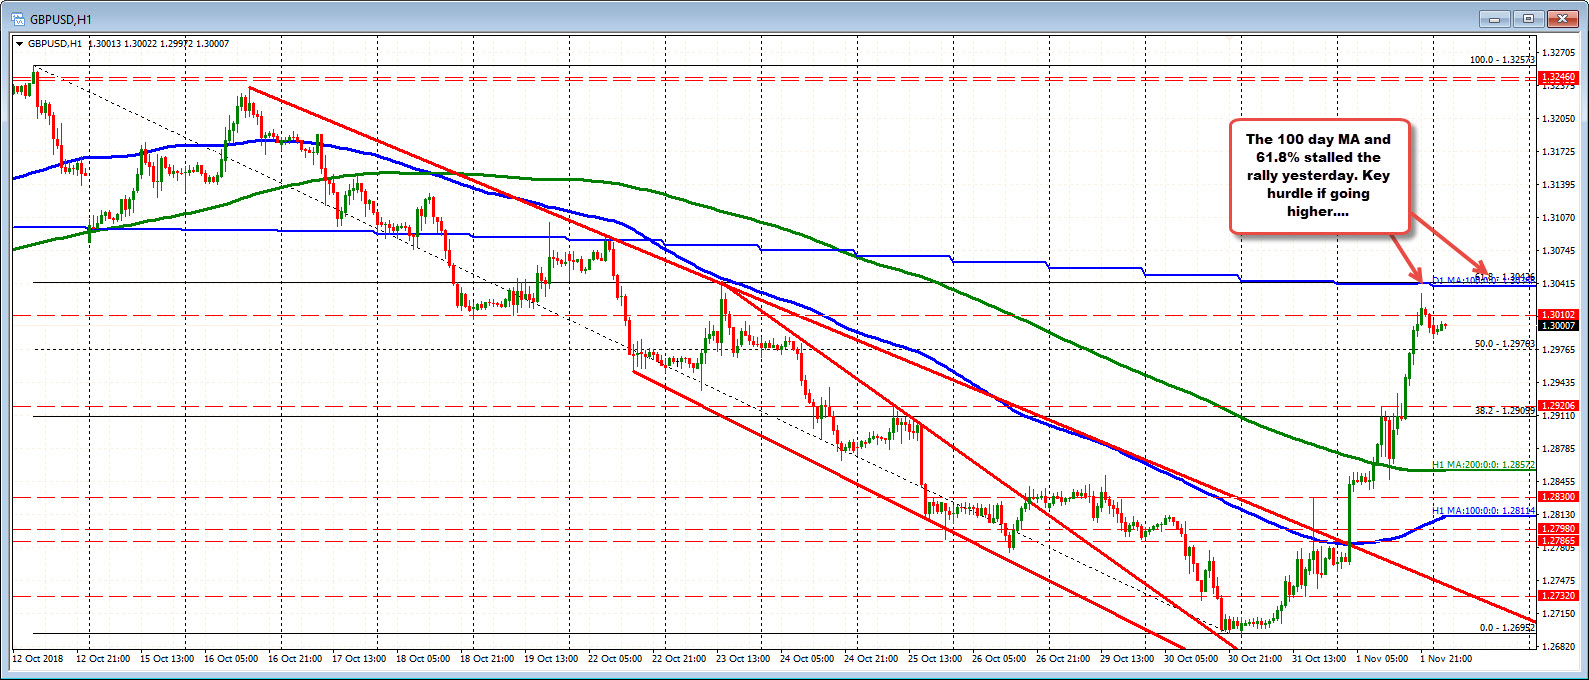
Traders did the "100 day MA lean" on the first test. The price has moved modestly lower since peaking (low reached 1.29874). We currently trade at 1.2998.
Looking at the daily chart below, the 1.3043-49 were swing levels from June and August. In September and October, the price traded above and below the level (see red circles in the chart below). The combination of the 100 day MA, the retracement the swing levels makes the 1.3038-49 a key area for buyers and sellers. Move above is more bullish. Move below keeps the sellers more in control.


