Looking more bullish.
Is it the dollar lower? Is it a big buyer or some other gold story? I don't really know, but what I know is gold is looking better technically.
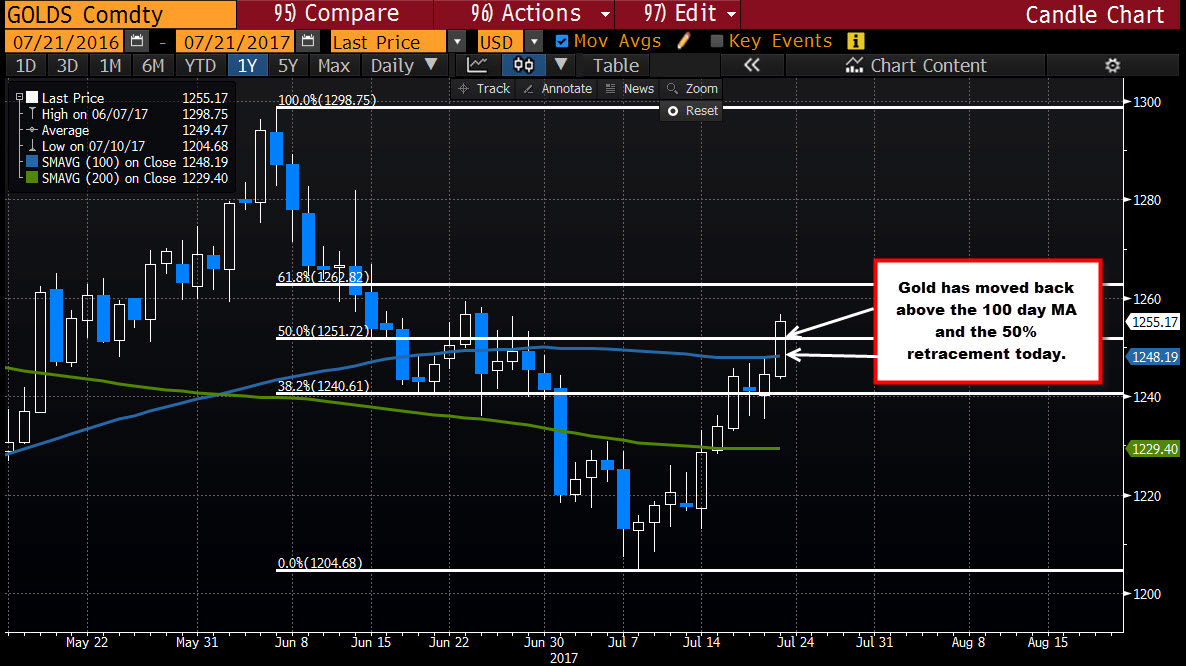
Today, the price has moved above the 100 day MA at 1248.19 (up over $10 on the day). It has also moved above the 50% of the move down from the June high at 1251.72. Each of those breaks has helped contribute to a more bullish bias for the precious metal. The $1251.72 (maybe down to $1250) is now risk for the longs.
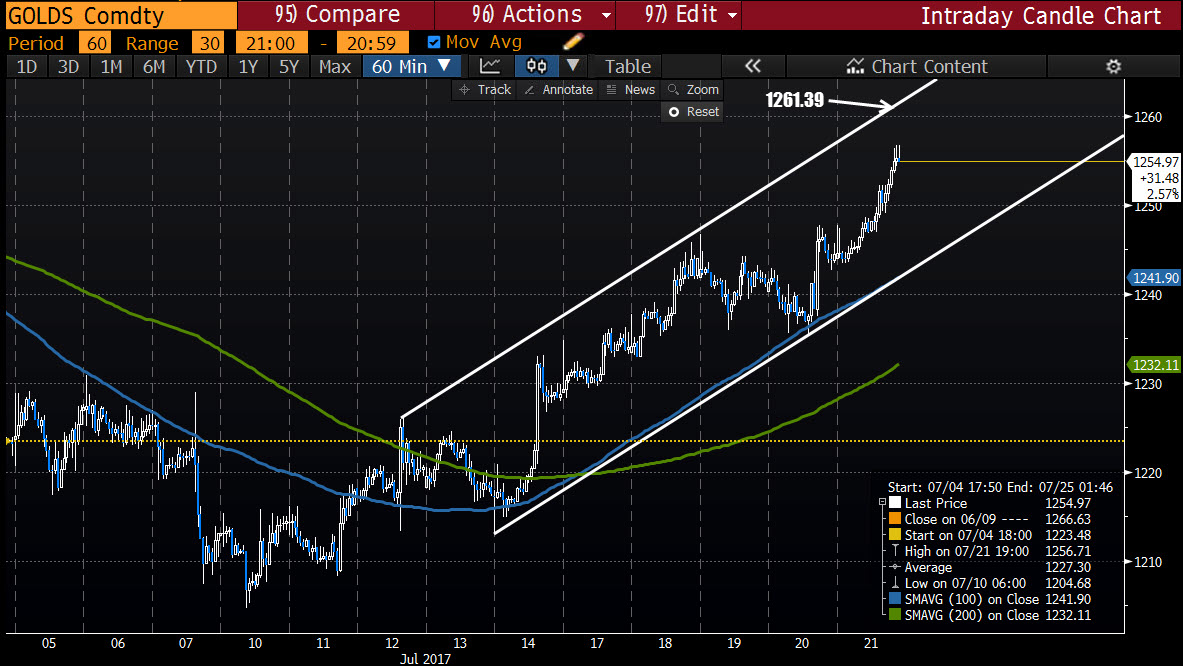
Drilling to the hourly chart (see chart below), the price tested its 100 hour MA yesterday, found support buyers, and took off to the upside. That too is a bullish move technically.
What next?
The topside channel trend line on the hourly chart comes in at 1261.39 currently (and moving higher). That line is the next target.
Going back to the daily chart, the 61.8% of the move down from the June high comes in a bit higher at 1262.82
That area (between 1261.39 and 1262.82) will now be eyed by the longs. Risk is the 1250-1251.72 area.