
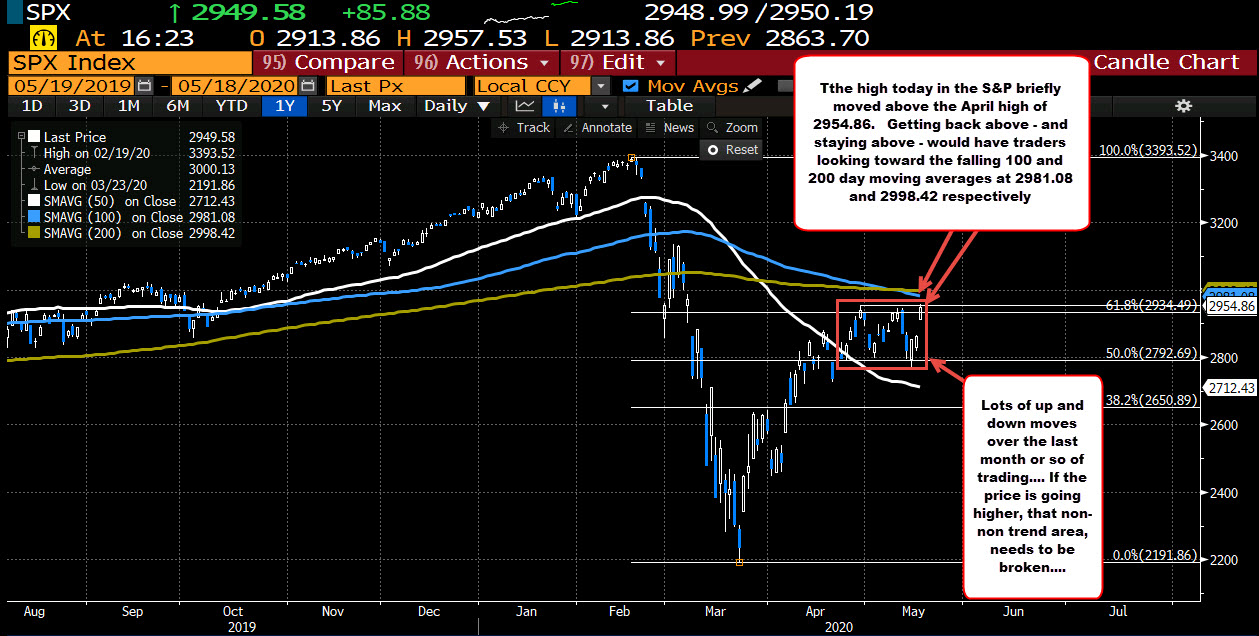
Extend above the April high of 2954.86
the S&P today has moved above the April high price of 2954.86 on its way to a intraday high of 2957.53. That took the price to the highest level since March 6. The current price is trading around 2949.
The market still has a lot of cash floating around from global stimulation, and that is helping the positive bias. Hopes for a reopening without incident is also helping the market.
From a technical perspective, the price remains above its 50% midpoint of the move down from the February high to the March low. That level comes in at 2792.69. At last week's low, the price did dip back below that 50% level, but rebounded sharply to the upside. There has not been a close below the 50% retracement since April 21. That is positive/bullish.
Now, over that period there have been a number of up and down moves as investor demand ebbed and flowed with the news headlines. So it isn't a one way bullish run.
In addition, the price is getting closer to its falling 100 day moving average at 2981.10. The 200 day moving average is a bit higher at 2998.43.. The price has not been above its 200 day moving average since March 3, nor above its 100 day moving average since February 24. Needless to say getting back above those levels would be a positive development from a technical perspective, and if done, would solicit headline news for the index. So far traders have been reluctant to get back above those levels.
From a fundamental perspective a move back above the moving averages would mean continued improvement from the coronavirus front and the market ignoring the likely escalation of frosty US China relations.
For today at least, lots of investable cash and hopes for coronavirus are guiding the bullish run, but upside work still needs to be done.

