
Holds near the 50% of the weeks range today
As we head to the close for the week, the EURUSD is
- Higher vs last Friday's close of 1.0609.
- The price bottomed on Monday ahead of the natural 1.0600 level (the low reached 1.06015). At the low the price dipped below a trend line on the hourly chart, but moved back above the trend line, and away after a few hours. The price also moved above the 100 day MA at 1.0628 area AND the 100 and 200 hour MAs
- On Tuesday, the price followed the GBPUSDs surge higher. US yields were also under pressure dampening dollar demand. The price rally stalled near the 50% of the move down from the March 2017 high to the April low. That 50% level came in at 1.0737. The high reached 1.07356
- Wednesday consolidated/corrected lower after holding the 50% level once again at 1.0737. The 50% was a ceiling.
- Thursday saw the price base and extend higher through the 50% level ceiling, and up to the 61.8% of the same move down at 1.0777. That retracement level (at 1.0777) was tested twice, before sellers started to take more control. The tumble lower saw the 50% level broken again. This time to the downside. What was support, became resistance (again),
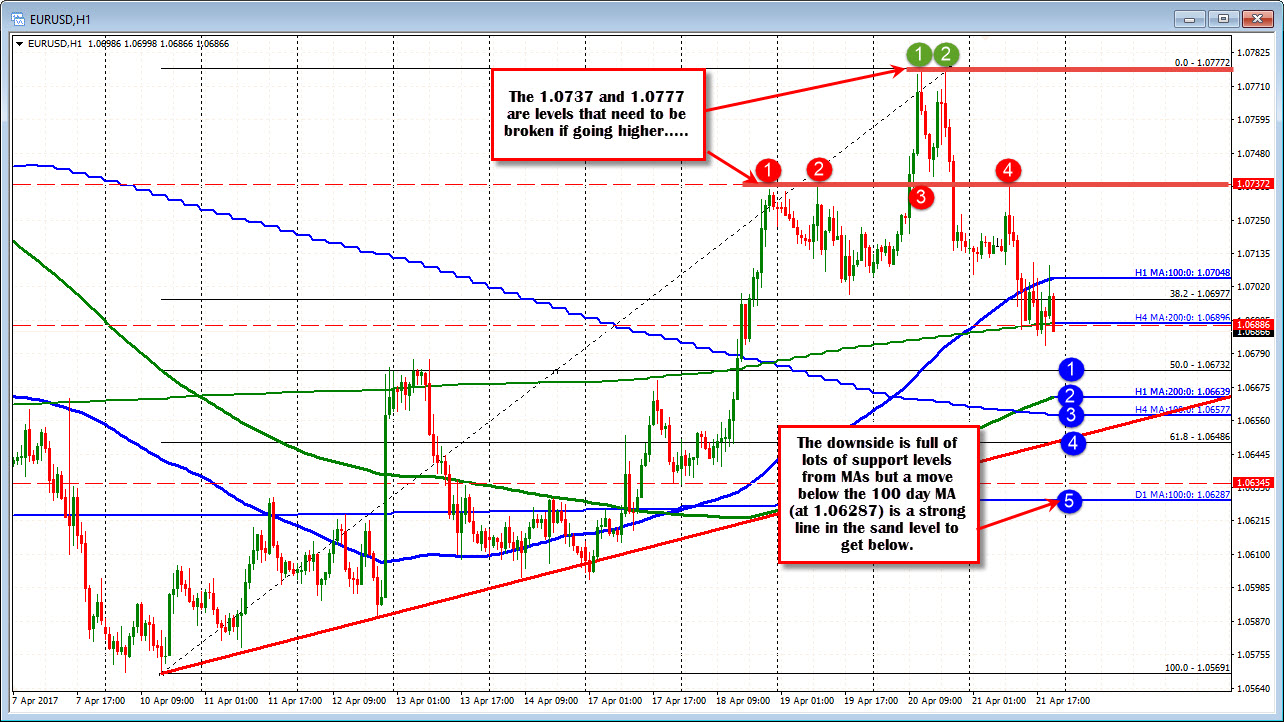
- Today, the 50% level held on the topside, and the price moved toward the 50% of the weeks trading range at 1.0689. The low did extend to 1.0682 but have seen a rebound.
Overall, the range for the week was about 176 pips. That is ok in what is a less volatile 2017. The high trading range for a week in 2017 is 280 pips. The low is 106 pips. In 2016 (by comparison), the low trading range was 123 pips and the high was 515 pips. We are just not seeing trends for long in 2017.
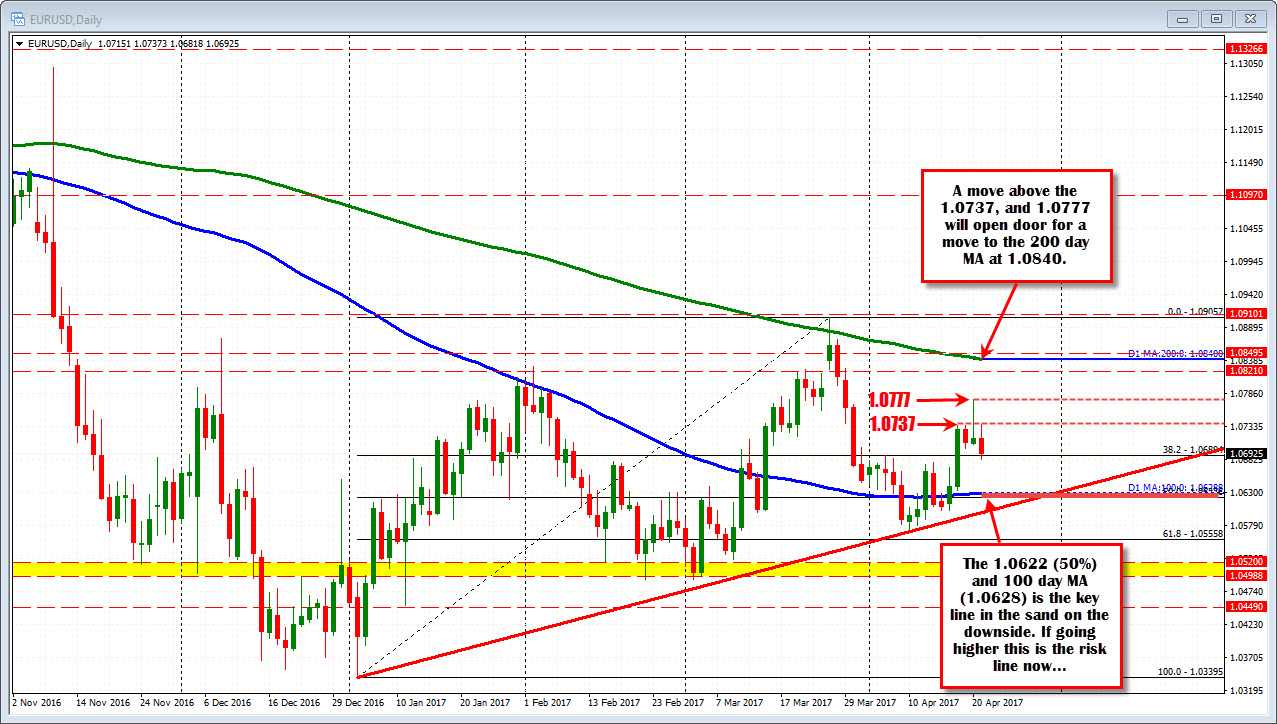
The midpoint of the year and 100 day MA comes in around each other oat 1.06226-288 (100 day MA is at 1.06288). With the price at 10698 currently, that can be a bullish above/bearish below line in the sand. Fundamentally, it would imply no surprises from France. Continued basing and improving in the EU and perhaps a Fed which is perhaps not so hawkish as Trump plans fizzle (or perhaps the market just loses faith in Trumps plans) and confidence erodes.
Closer support might be at 1.0673 which is the 50% of the April trading range.
On the topside, I need to see the ubiquitous 50% broken (and remain broken) at 1.0737. Above that the 1.0777 (double top and 61.8%) . Clearing those hurdles opens the door for a move toward the 200 day MA at 1.0848 currently. The price moved above the 200 day MA in March for a few hours but failed. There has not been a close above the 200 day MA since October 2016.

