Geez....
The 1.1435-65 level is starting to be a cliche. How many times have you read something like this:
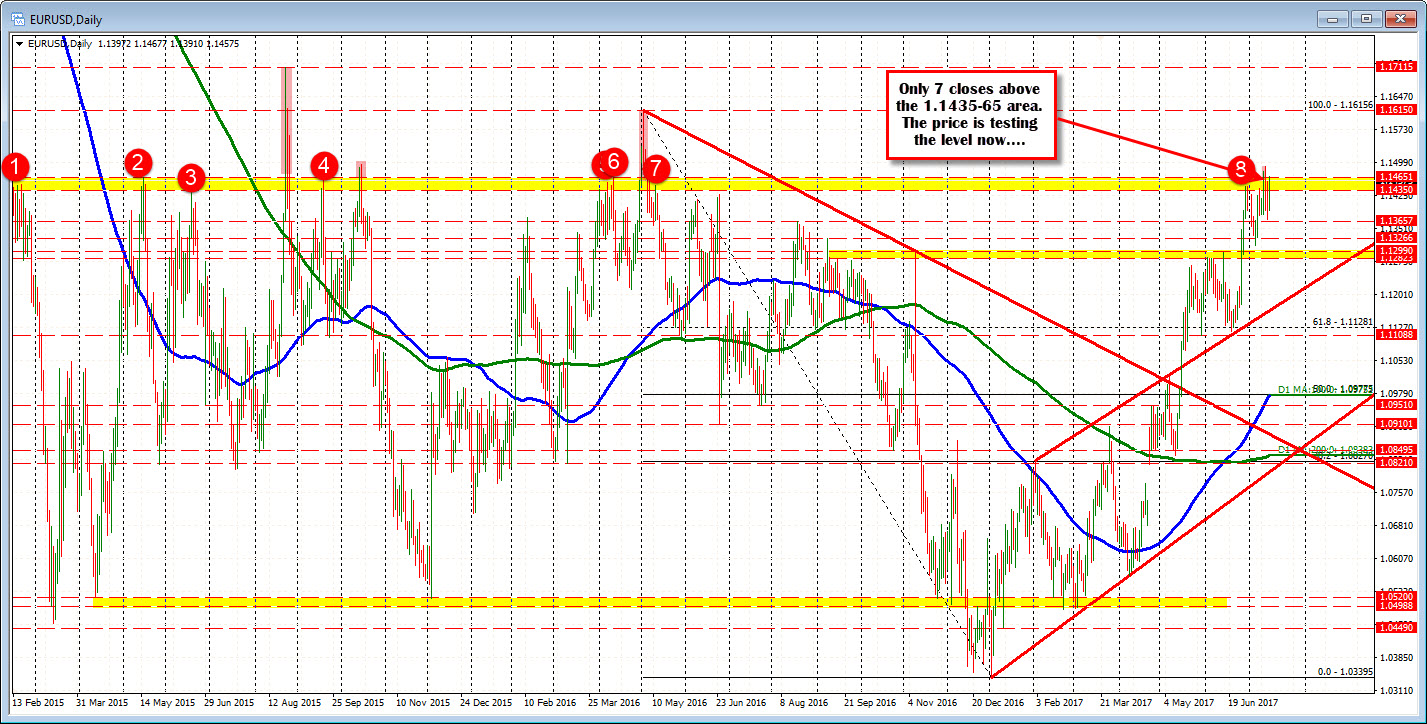
"The 1.1435-65 area represents a number of swing levels going back to February 2015 (see the yellow area in the chart above)".
I don't even need to show the picture anymore. I see it in my sleep. How about you?
And today....
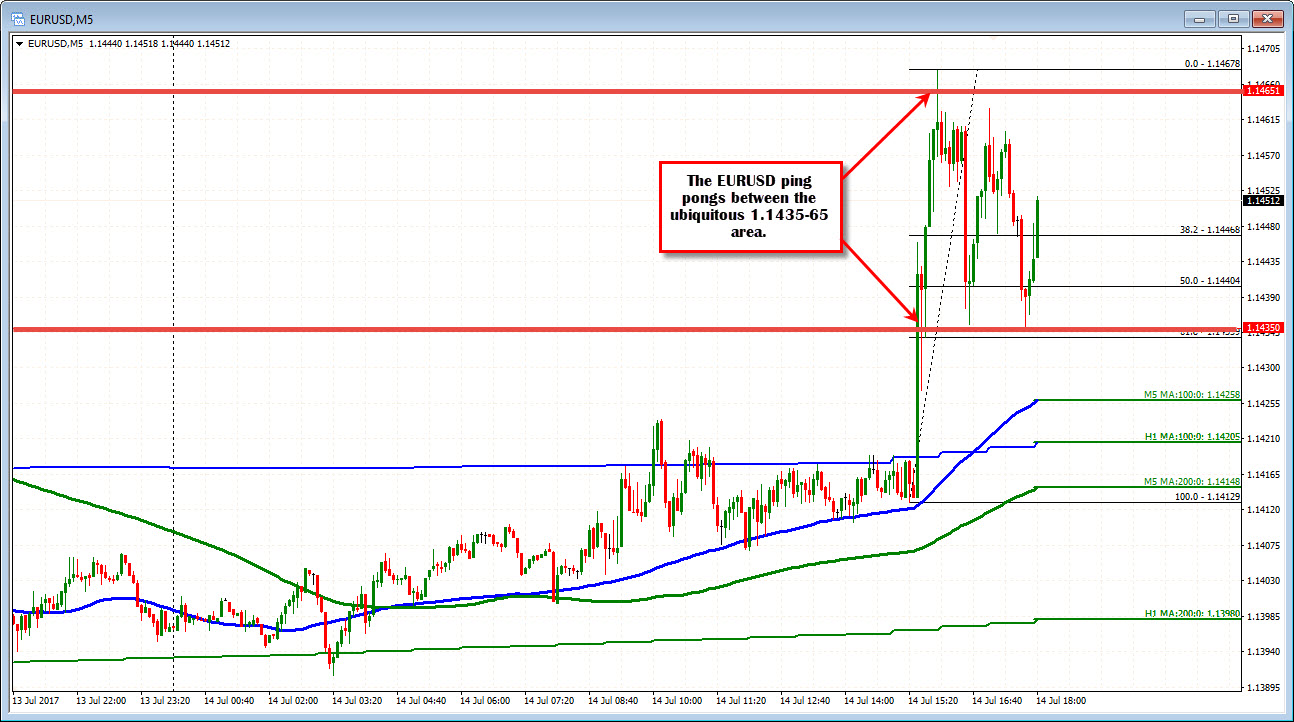
The high spiked up to 1.14677 (it was above 1.1465 less than a minute) and rotated lower to 1.14355. The move higher stalled at 1.14629 - just ahead of the 1.1465 level), and rotated back down to 1.14351. The price trades at 1.1448 now.
The price is ping-ponging between the 1.1435 and the 1.1465 area. Come on.... Geez.
Well, we know the boundaries.
Which way are we going to break? Chime in? I am getting sick of it!
(OK...below is the nightmare picture of the daily chart).