
DId I mention the head and shoulder
The not best kept secret plays out with the price of the EURUSD testing the 100 day MA and the lows from August and earlier this month.
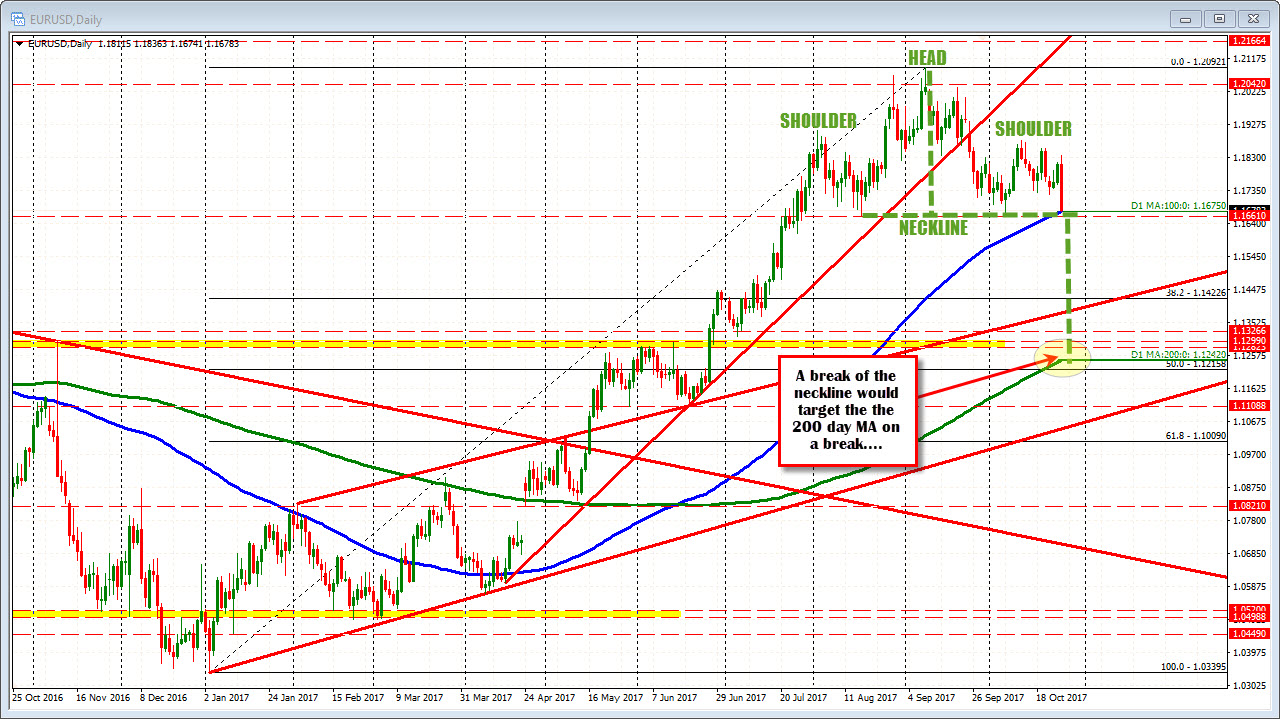
- The 100 day MA is at 1.1675
- The low this month stalled at 1.1668
- The low from August stalled at 1.1662
The low just reached 1.16741.
Of course the daily chart, also looks a lot like a head and shoulders formation. Technically, a break of the neckline targets the distance from the neckline to the top of the head (green dashed line). That distance would imply a fall that basically targets the 200 day MA (green line at 1.1242.
Now many a head and shoulders have formed, been broken and did not go anywhere near the projected target. However, if the lows and MA is broken (and the neckline too), that is a bearish move technically. There should be more selling as long as the price stays below the broken levels. Along the way there will be interim targets that will be hurdles to get to and through.
If the steps can be taken, the measured target may be reached. However, understand, there will be many a step from 1.1662 to the 200 day MA at 1.1242.

