
The technical picture
The EURUSD traded to the highest level since the August 24, 2015 spike, that saw the pair move up to 1.1711. The high price on Friday reached 1.16825.
For the week, the pair was up 4 of 5 days. The low on Monday based at 1.1434. We all remember the 1.1435-65 resistance area that the pair had to get to and through (see yellow area on the daily chart below).
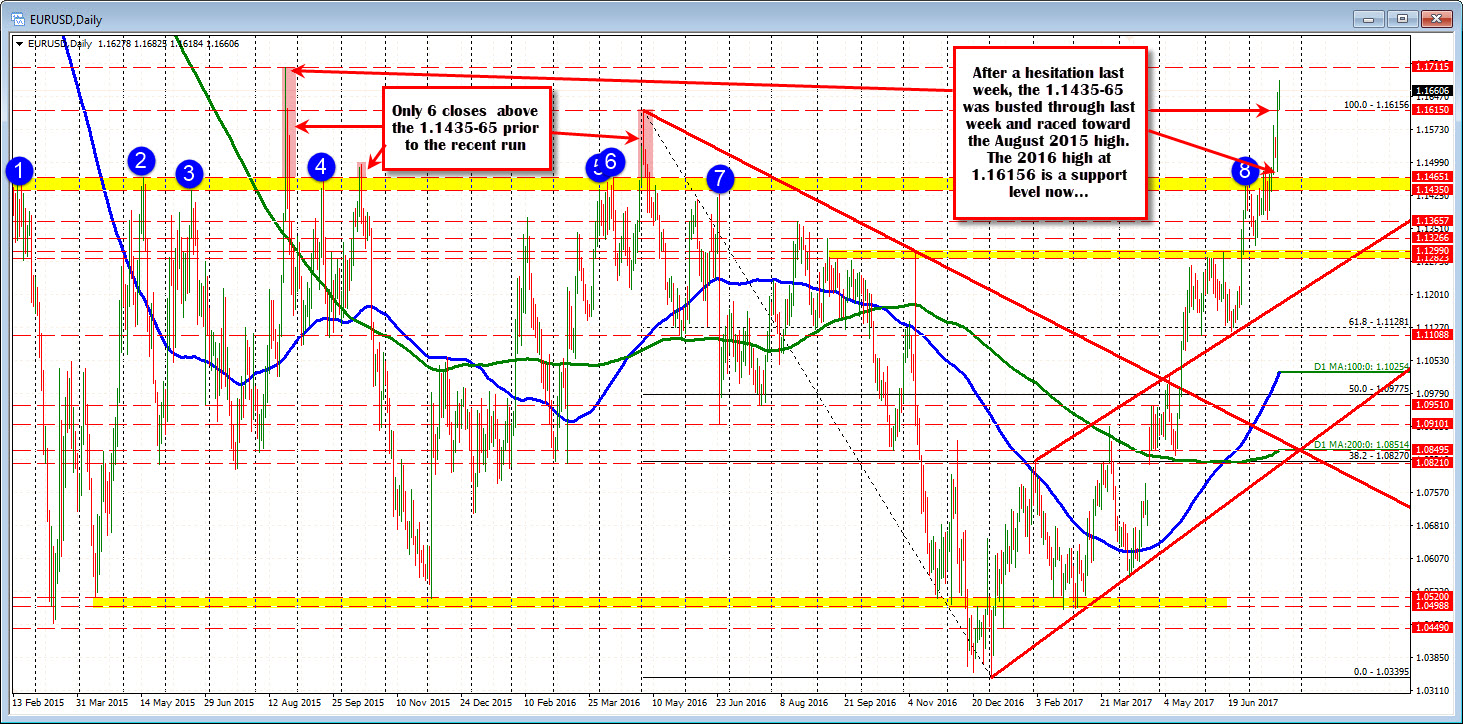
Well that area was broken, and the price closed above the key ceiling on each trading day last week. On Thursday, the pair moved above the high price from 2016 at 1.16156 and stayed above it on Friday (low reached 1.1617). That level is now a close risk level for longs into the new trading week (see daily chart above).
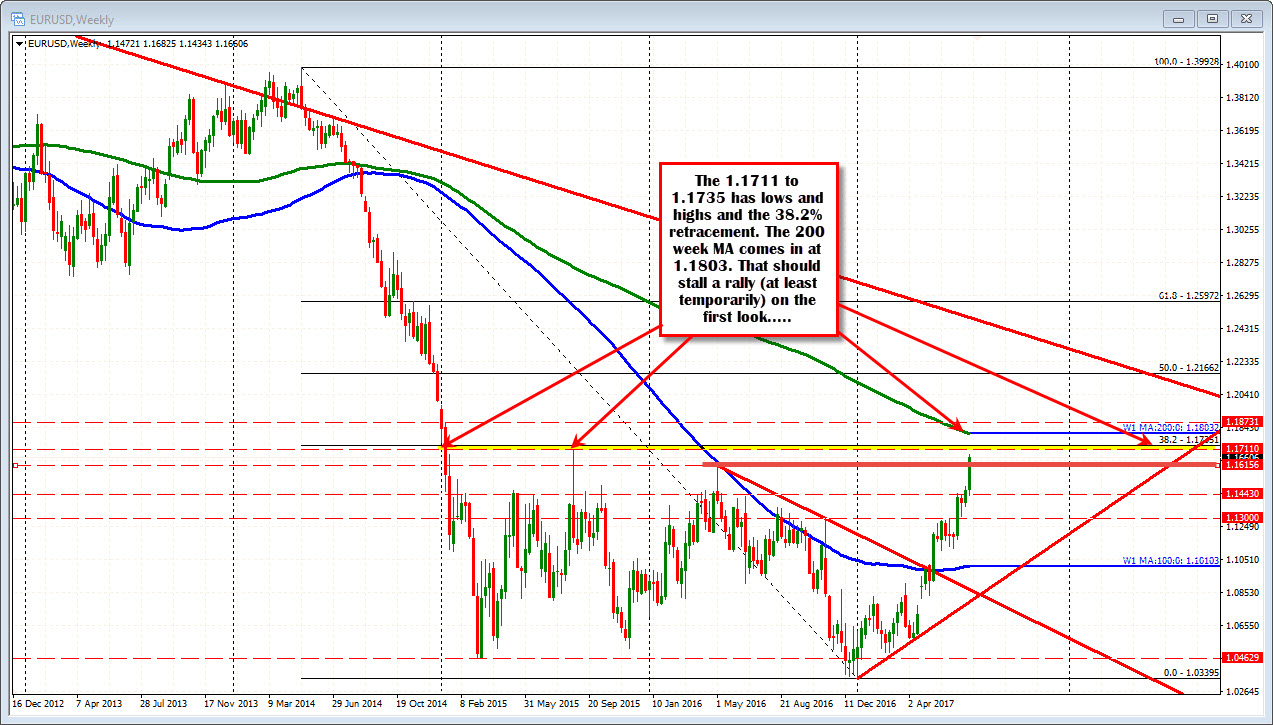
On the topside the 1.1711 is high from August 2015. The 38.2% of the move down from the 2014 high comes in at 1.1735 (see weekly chart). The 200 week MA comes in at 1.1803 (green line on the weekly chart above). Those are the targets to the upside. If the 200 week MA is tested I would expect sellers to line up (at least on the first look). The price has not traded above the 200 week MA since August 2014.
The speculative position is long the EUR and those specs seem to have some trading clout. So as long as the price stays above 1.1615, the buyers are in firm control A move below muddies the water a bit.
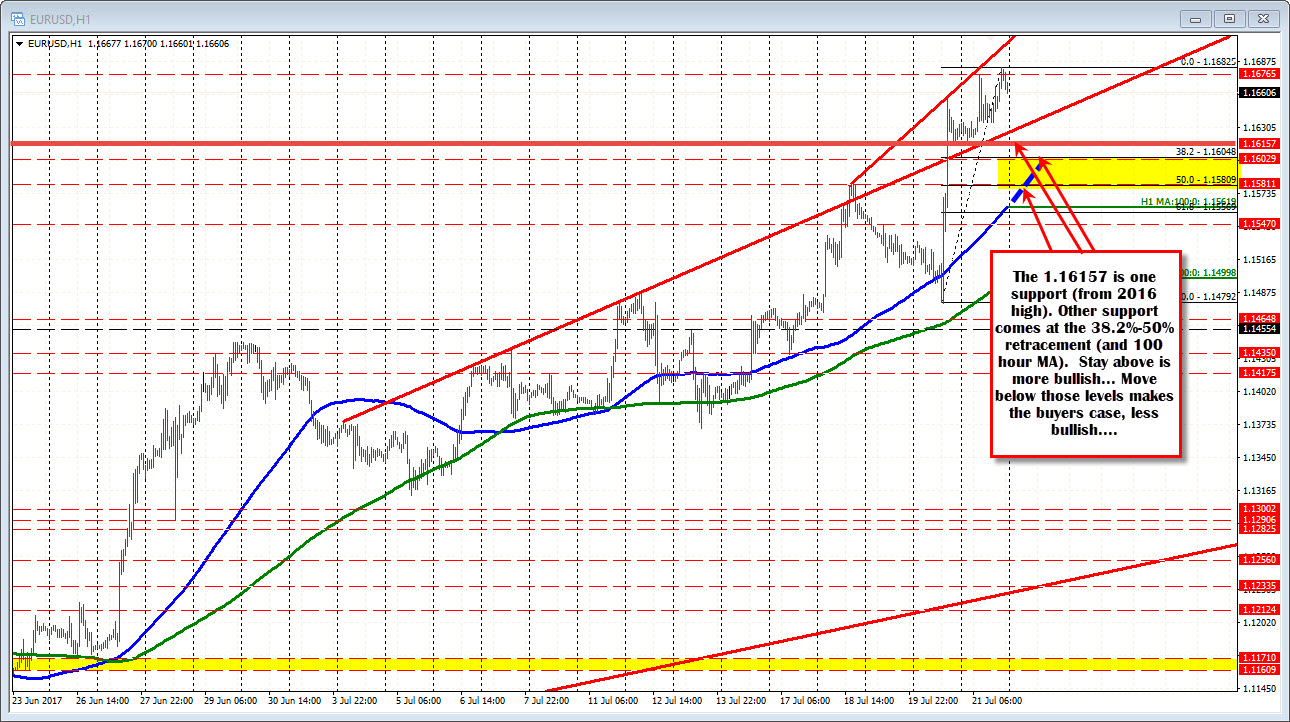
Drilling to the hourly chart below, the 1.1604 and 1.1581 level are the 38.2-50% of the move up from the Thursday low. If the 1.1615 level is broken, the water is muddy. If the 1.1604-1.1581 area is then broken, more buyers are likely to give up. We could then see a rotation back toward the 1.1435-65 level.
You can read other technical thoughts going into the new week by going to the wrap from Friday (click here).

