
Is it just a correction?
The Nasdaq sure took it on the chin today.
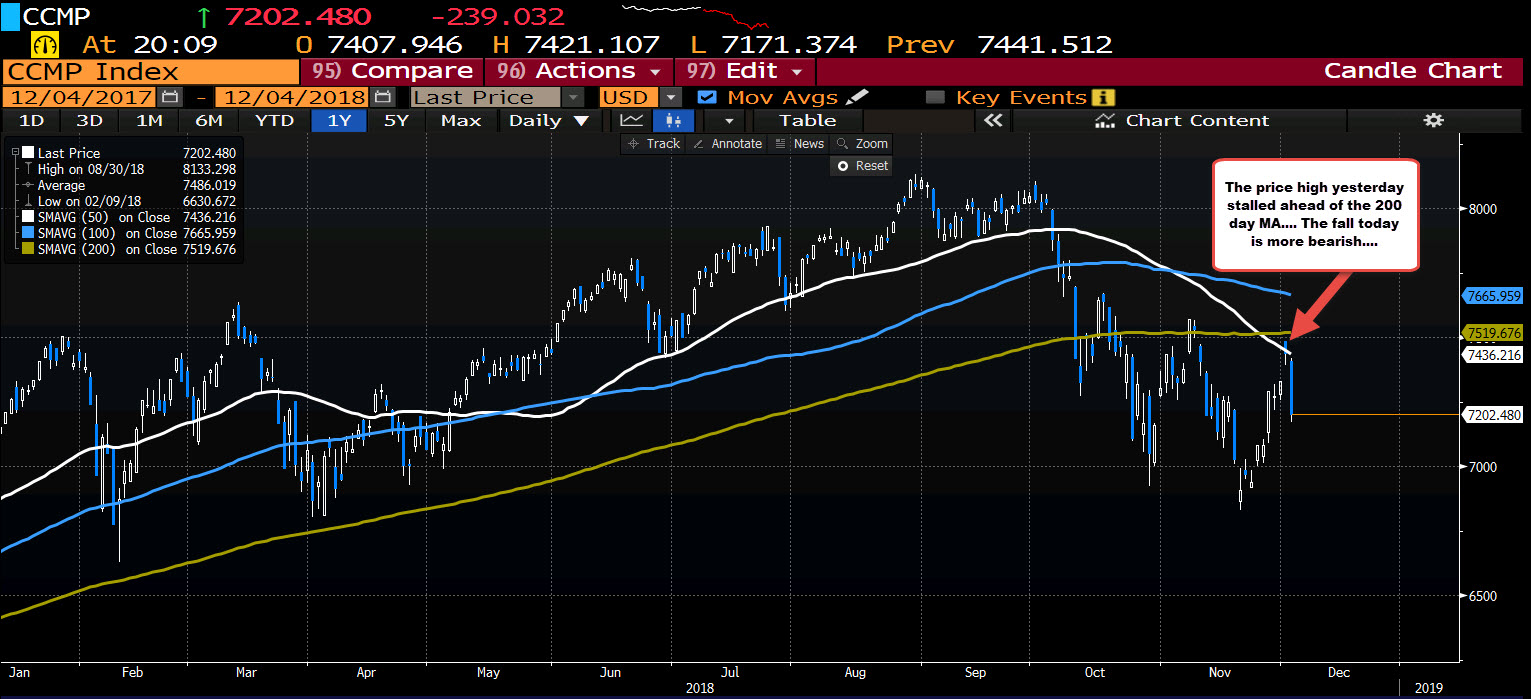
Looking at the daily chart above, the high yesterday stalled just ahead of its 200 day MA at 7519.86. That came after a gap higher on the weekend US/China "truce" (was it as much as the US said it was?).
Today, the price moved down, and down some more. In the process, the price moved away from that key 200 day MA. Bearish.
Drilling to the hourly chart below, the price fall took the price down through the 200 hour MA and 50 hour MA (green and white lines below) but stalled just ahead of the 100 hour MA at 7160 (blue line) AND the 50% of the move up from the November low. The 100 hour MA comes in at 7160. The 50% retracement comes in at 7158.637. That area from 7158-7160 is key.
The silver lining is if that 100 and 50% can hold, this could be a corrective move. IF broken, there should be more selling.
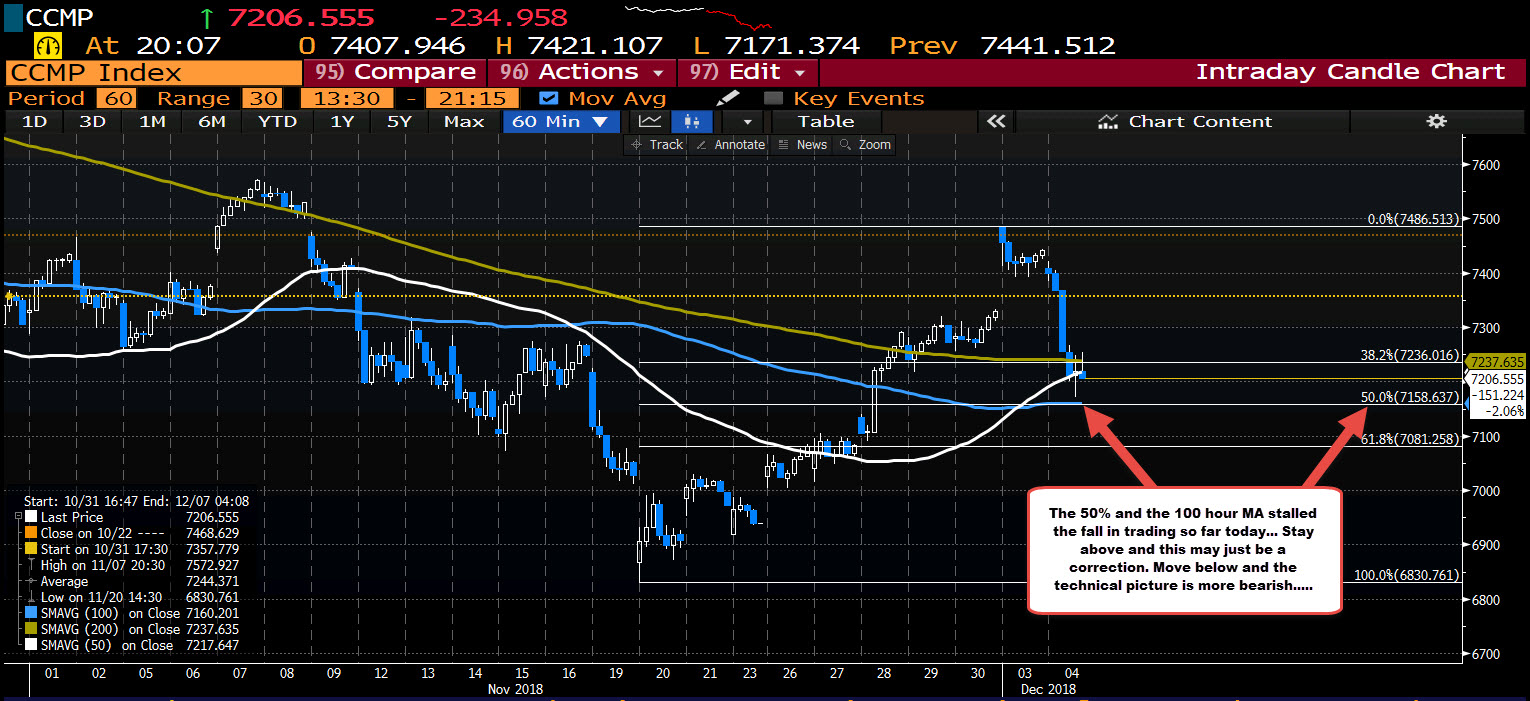
Tomorrow the stock markets are closed due to the funeral for Pres George H.W. Bush. Unless the price goes and takes out the low in the last hour of trading, Thursday will be a key opening for the bulls and the bears and could shape the price action going into the end of the year.
What about the S&P?
On the S&P index daily chart below, the price moved above the 200 day and 50 day MA YESTERDAY, but stalled ahead of the 100 day MA (blue line).
Today, the price moved sharply lower, filling the gap from Friday and tumbling lower.
What is important to note is that the 50 day MA is getting ready to move below the 200 day MA. That is the so called "Death Cross", and on a cross-over it is a bearish signal (and also sounds quite ominous).
Note that the Nasdaq already has triggered that bearish trigger in last weeks trading. The E-minis are ready to make the cross too. Bearish.
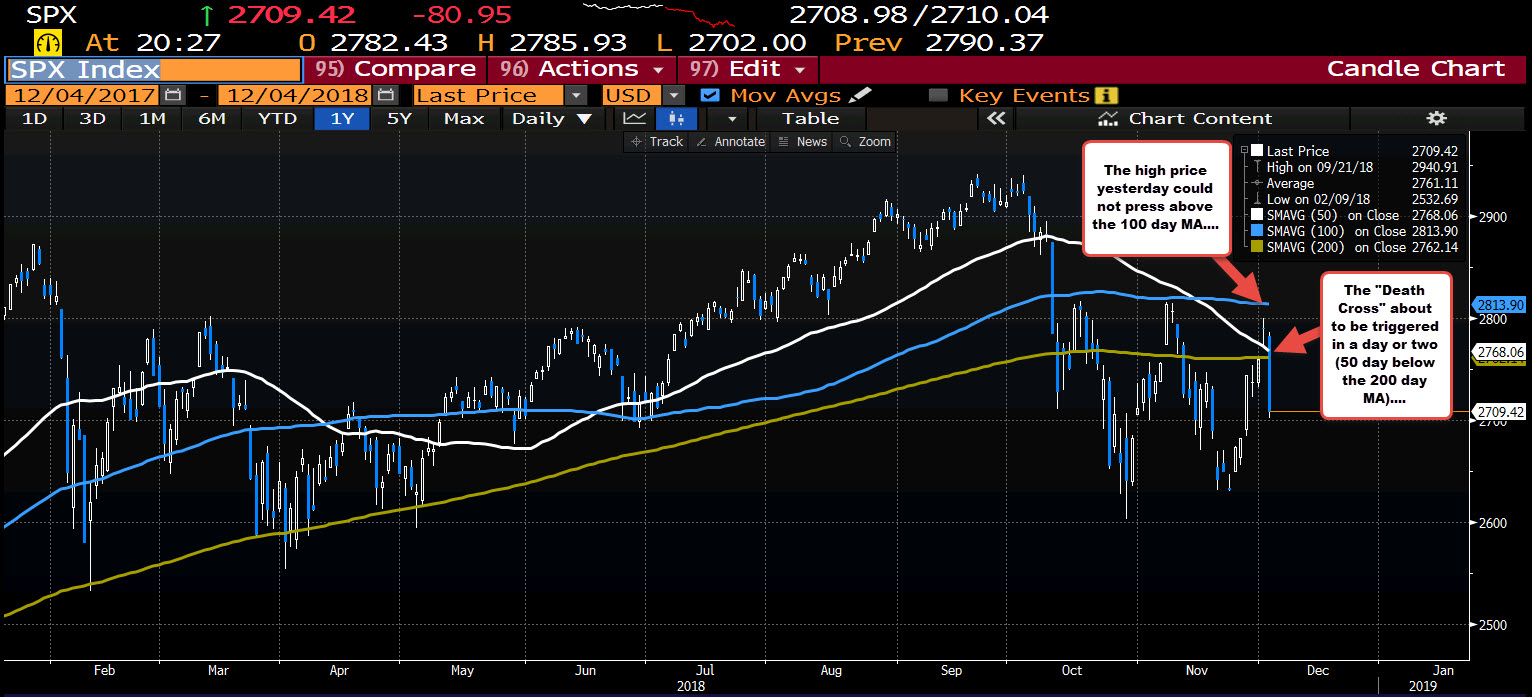
Be aware that the media may start to talk more about that formation and trigger.

