Trades unchanged on the day
The S&P index tumble lower on the opening and in the NY morning session. At the low, the index reached 2647.32, down -30 points on the day. The market started to rebound and reached at high of 2685.46, or plus about 8 points.
Currently the index is trading at right around unchanged.
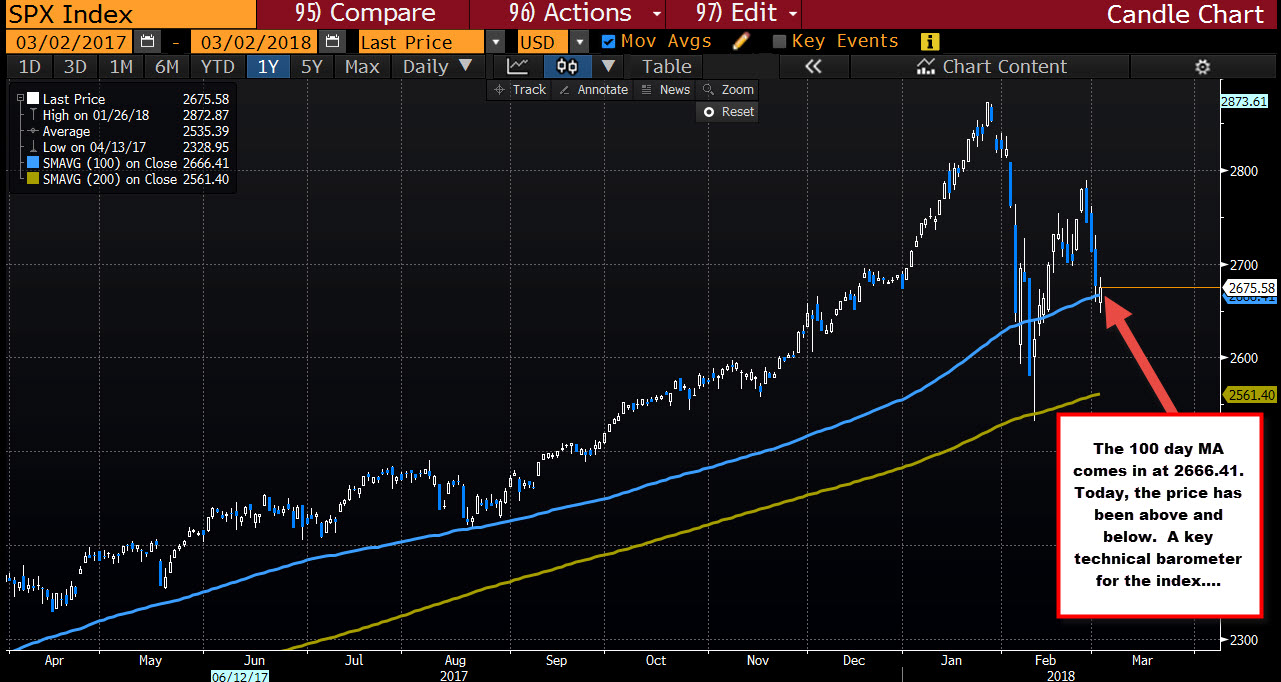
Technically, looking at the daily chart, the price on Monday and Tuesday pushed higher, but then started to move lower and lower. The index fell from a high of 2789, a low today at 2647. That is a 5.09% decline from the peak.
Today, the price made a move below the key 100 day MA. That MA comes in at 2666.41. We currently trade above, but for the rest of the day and going forward, that moving average will be a key barometer for the traders. Be aware.
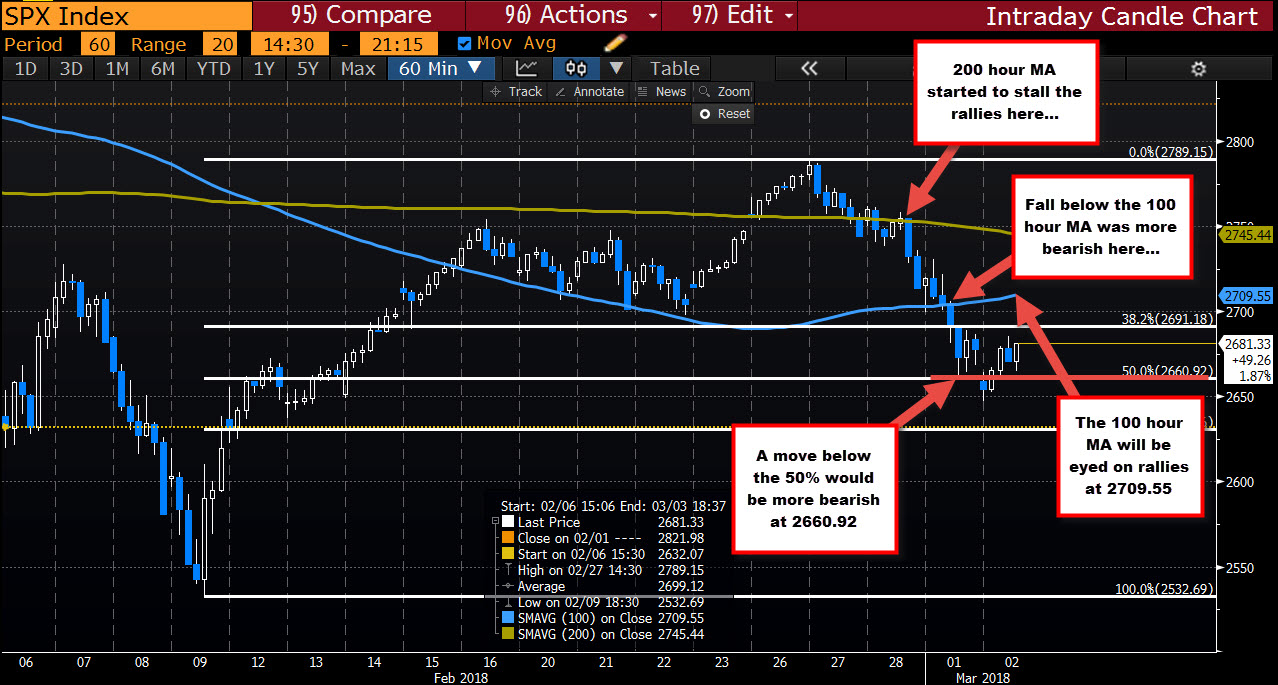
Drilling to the hourly chart, this week the price stepped below the 200 hour MA on Wednesday (green line) and the 100 hour MA (blue line) in trading yesterday. That 100 hour MA comes in at 2709.55. On a move higher from here, that would be an upside hurdle to get to an through (it may also be a level to sell against so be aware).
On the downside, the 50% of the move up from the February 9th low comes in at 2660.92. The price moved below that level on the tumble earlier today, but stalled and started to move back higher. Get back below (it would be below the 100 day MA too at 2666.41), cracking the 50% would be anther step in the bearish direction.