Bounce off the 100 day MA target
The USDJPY is up testing a resistance swing area defined by swing levels going back to November 20th.
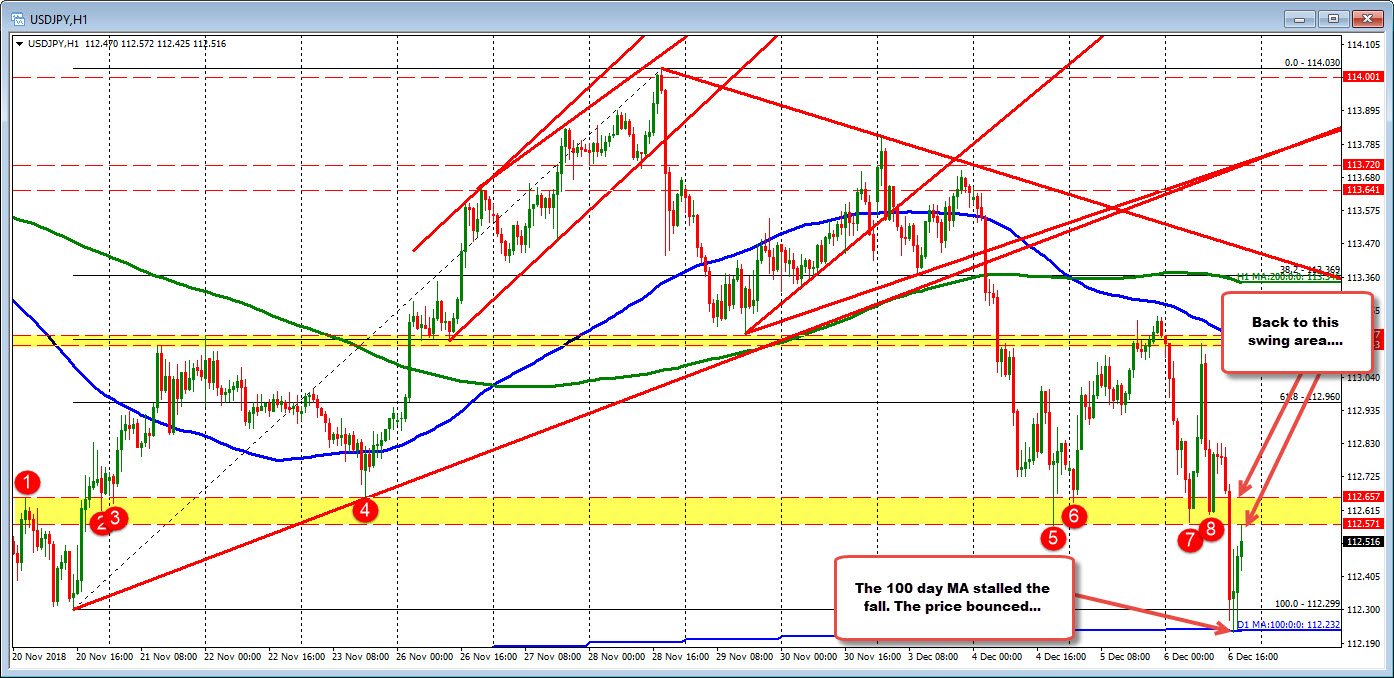
The move higher started after testing the 100 day MA (see prior post - blue overlay low at 112.232). That level held on two separate hourly bars.
Like the 100 day MA below, this area is level where the "market" has a decision to make. Move above and there should be more momentum. Find sellers here (there should be some profit taking from the buyers below) and the battle between the swing area above and the 100 day MA below is underway.
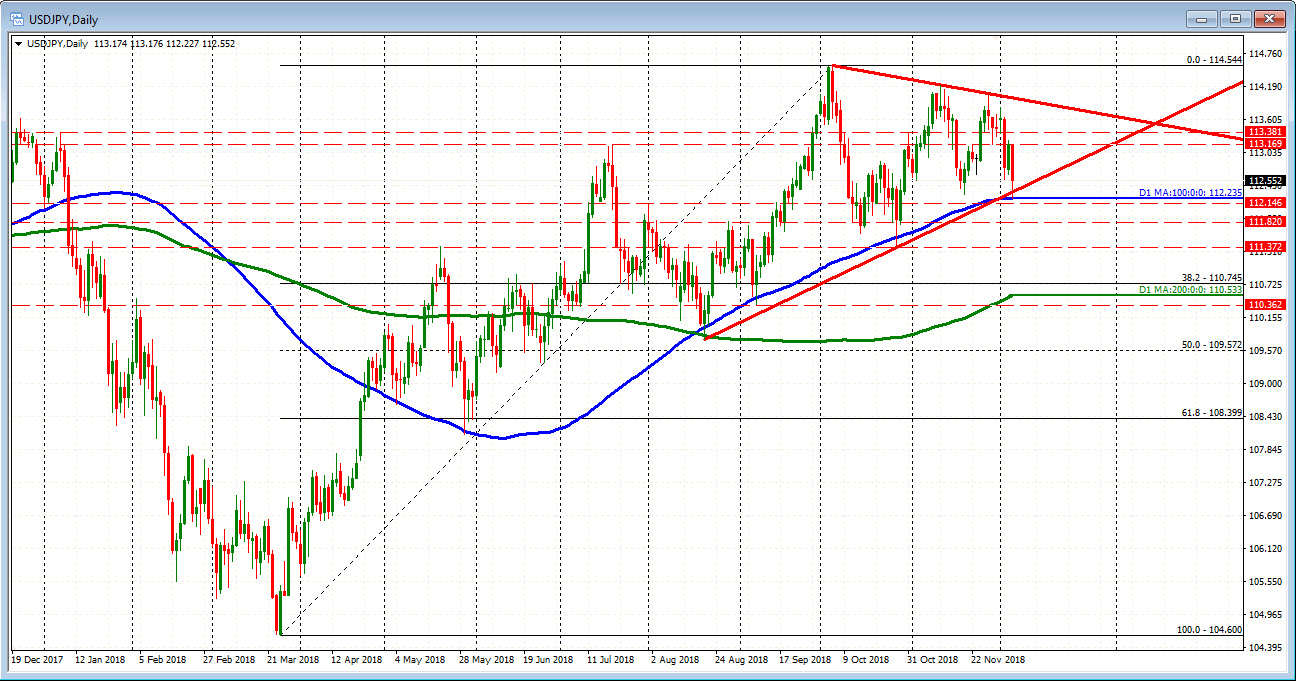
PS this is what it looks like on the daily chart. The trend line was a bit higher than the 100 day MA at 112.32. The 100 day MA and the trend line are a support area.