Tested a swing area on the daily and backed off
Yesterday in posts, I spoke to the target area in the 114.36-49 area. That was home to a number of swing levels on the daily chart going back to May 2017. The price moved to a high of 114.535 on the back of the hawking comments from Powell late in the day and started the new day looking at whether to go higher, or correct lower.
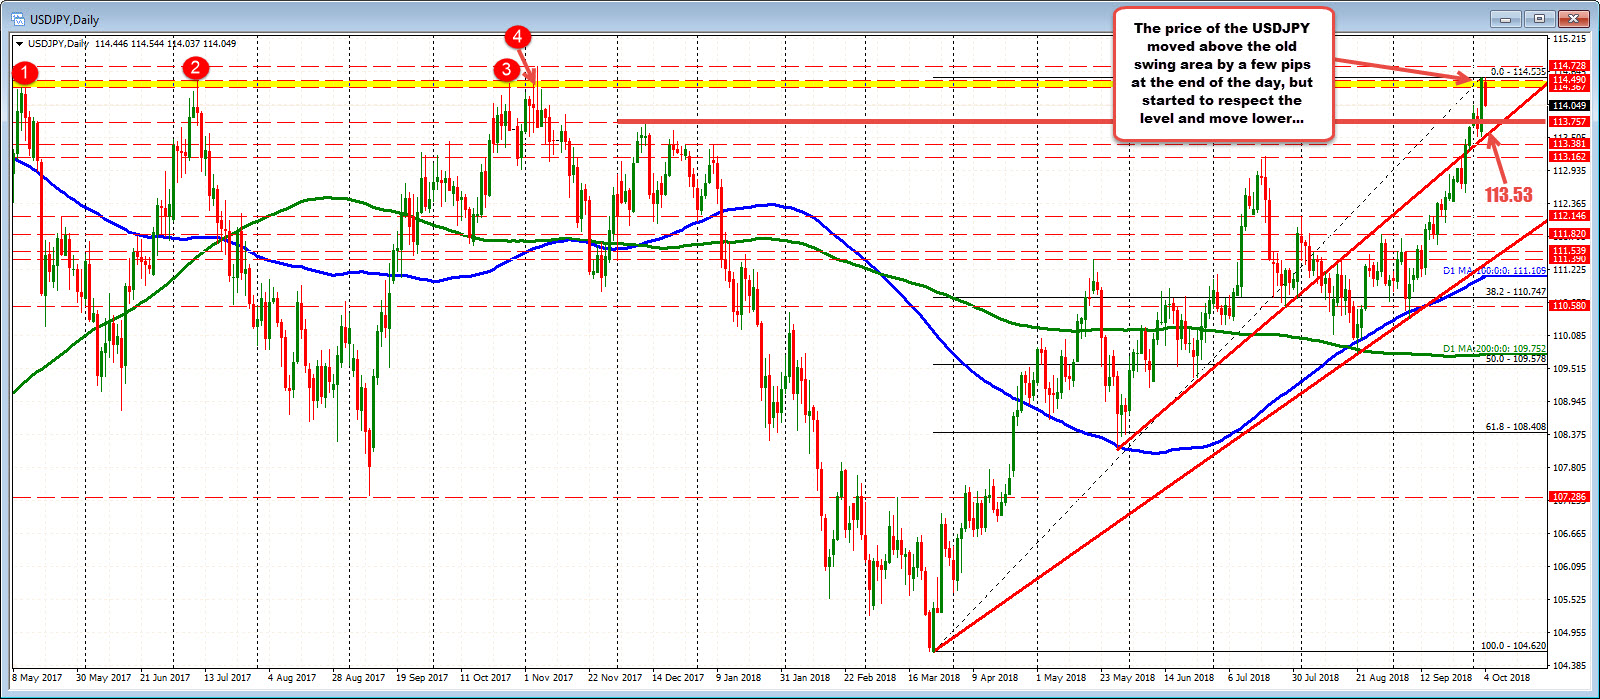
Traders leaned. The price started to dip lower. We are not trading to new session lows on the day and move to test the 114.00 level. On the daily chart, the 113.75 was a swing high from December that is a target. The old trend line, which held support before the last leg higher this week. comes in at 113.53.
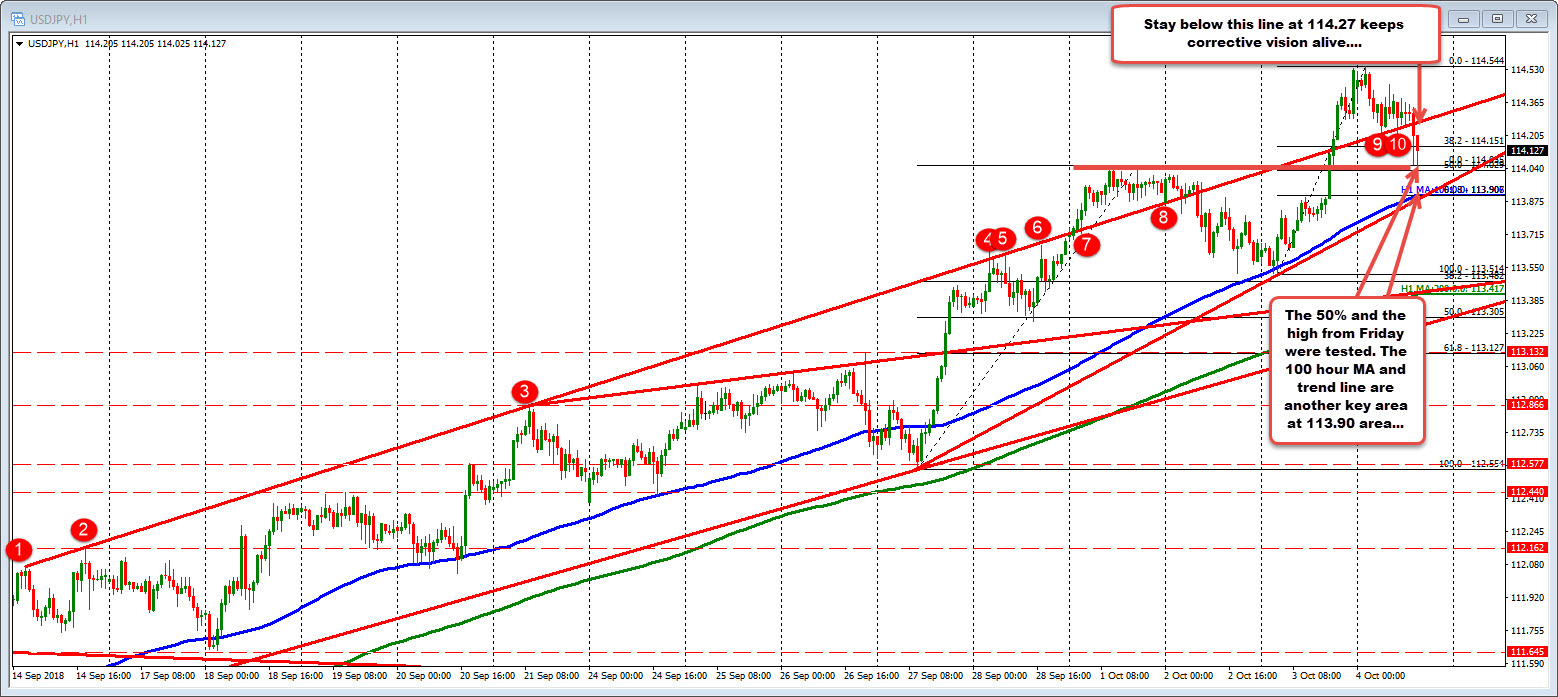
Drilling to the hourly chart below, the price rise has cracked above a topside trend line twice this week. Each time, the pair tried to stay above, but pressure gave way, and the price moved back lower.
The recent crack back lower in the last few hours, has taken the price to the 50% of the last move higher and the high from Monday at the 114.02-055 area. We trade at 114.11 now.
A move below will look to test what will be a key level defined by the 100 hour MA and a trend line at 113.90 area. The 100 hour MA held support on the last correction this week. On another test, will that find the buyers. On the topside, the underside of the topside trend line comes in at 114.27. Stay below keeps thoughts of more corrective action alive. Sellers can lean against that risk defining level