
Lots of things converging on different charts above
The USDJPY is inching higher and in the process is getting closer to a number of technical levels from various charts.
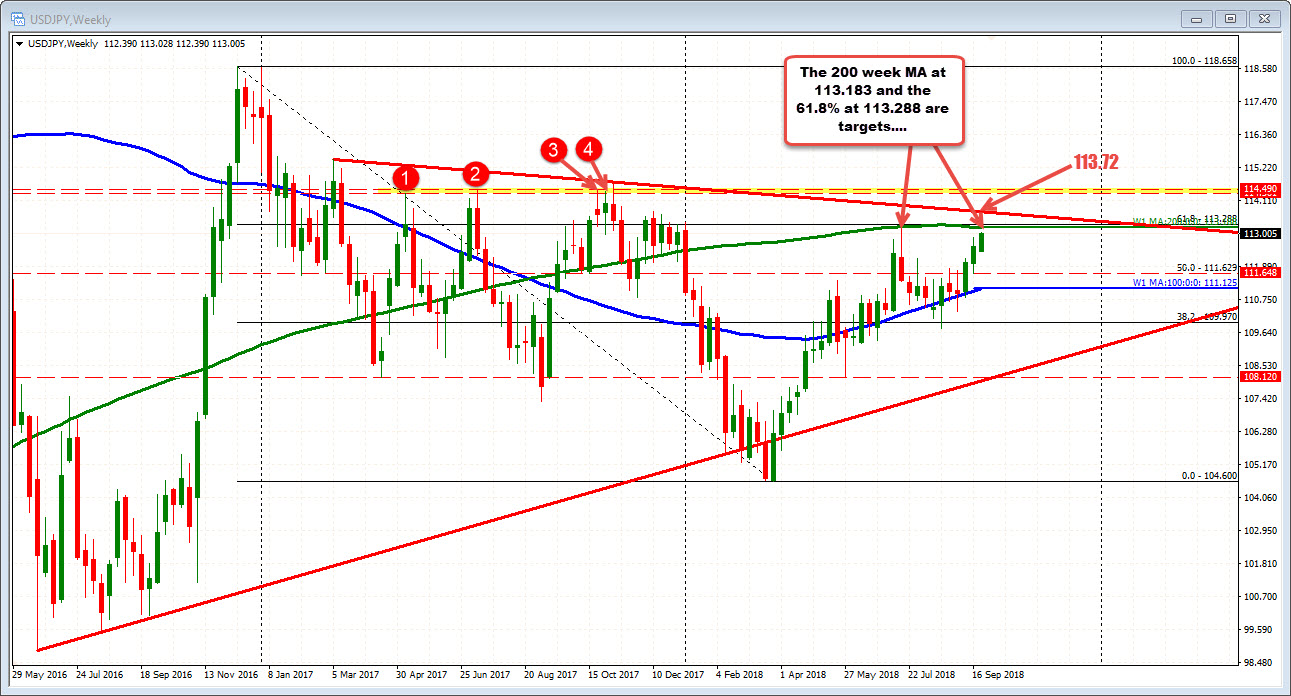
Staring with the weekly chart, the 200 week MA comes in at 113.183 and the 61.8% of the move down from December 2016 high comes in at 113.288. Back in July, that MA and retracement was approached and the price moved back lower. A move above looks toward 113.72 trend line.
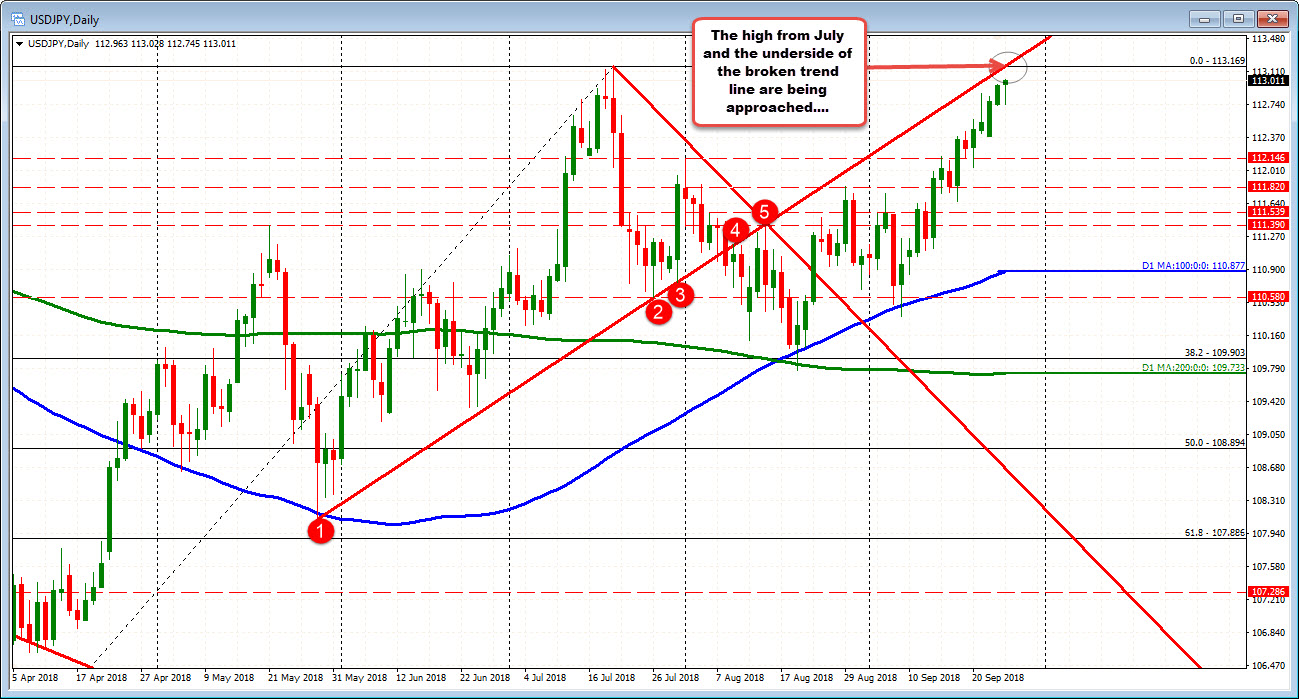
Stepping to the daily chart below, the high from July is joined by the underside of a broken trend line at 113.169 area.
Drilling to the hourly chart, there is a topside trend line at the 113.08. The pair earlier today stumbled lower but stalled near the swing low from yesterday at 112.74. That level and the rising 100 hour MA and trend line (at 112.68-70 area - see blue line in the chart below) are key downside targets IF the overhead resistance stalls the rally, and buyers turn to sellers. Before that area, watch for a move below the high from Friday at 112.87 area as a bearish clue.

SUMMARY: The weekly, daily and hourly have a lot of overhead resistance being approached. Sellers are likely to lean against the area, but expect stops on a break above.
On the downside, the hourly chart will control the bearish bias targets with a move below the 112.87 and then the 112.68-70 as a key target (rising 100 hour MA and trend line).

