
Tough ceiling at 114.37-49
The US GDP sent the USDJPY to a new session high on Friday, but the pair stalled against a ceiling area defined by swing highs from April at 114.37 and July at 114.49. The high peaked at 114.44 - in between the two levels.
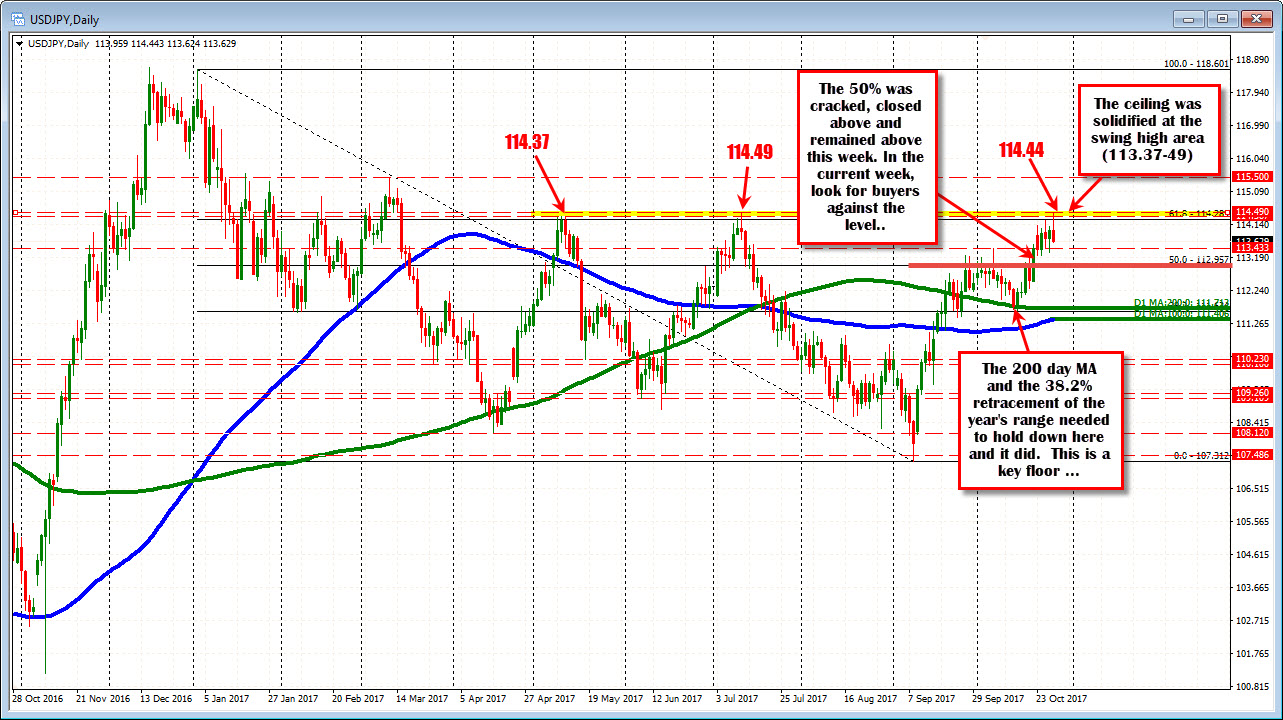
The price rotated lower in the Friday NY session. Lower yields on the "mix of GDP", and Fed's Powell as the front runner for next Fed chair (like Yellen but not the Obama nominated Yellen) helped, but the technical hold at the key resistance certainly did not hurt. Bears took control. The price closed the week at around 113.68 - nearly 80 pips off the high.
So what does the price action and technicals say in for the current week?
- The 1.1437-49 area becomes even more important as the ceiling was solidified by a third potential high. Traders like solid foundations and ceilings to define and limit risk. There could be another forming. So for that reason, I have to respect the wishes of "the market". Look for sellers to lean against that level on tests BUT expect stops on a break above.
- As strong as the ceiling is, we also cannot ignore what happened at the October month's lows. Looking at the daily chart above, the lows for the month stalled at the 38.2% and the 200 day MA (green line in the chart). That was an area that needed to find buyers a few weeks ago, and they came in (risk was defined and limited. So that area (from 111.62-713) is a key support/floor area.
Between the ceiling and floor areas sits the 50% retracement of the 2017 trading range at 112.957 (call it 113.00). On October 20, the price raced and closed above that tipping point, and trading this week did really get close to it (the low reached 113.238 on Monday).
With the current price between the 50% year midpoint and the ceiling above, and the 10 year yield in the US (it is a big influence on the USDJPY) also at a crossroad at the 2.40% level (it closed at 2.42% on Friday), the forex market is properly place between the extremes. How the wind blows with the data - especially employment on Friday, will likely help to dictate the ebbs and flows. The pre-NFP stuff (ADP, ISM) will also influence.
A break of the 50% will look back toward the 200 day MA as the next key target.
A break of the ceiling (114.37-49), will look toward the March 2017 high at 115.50.
Anything other technical clues between those extremes?
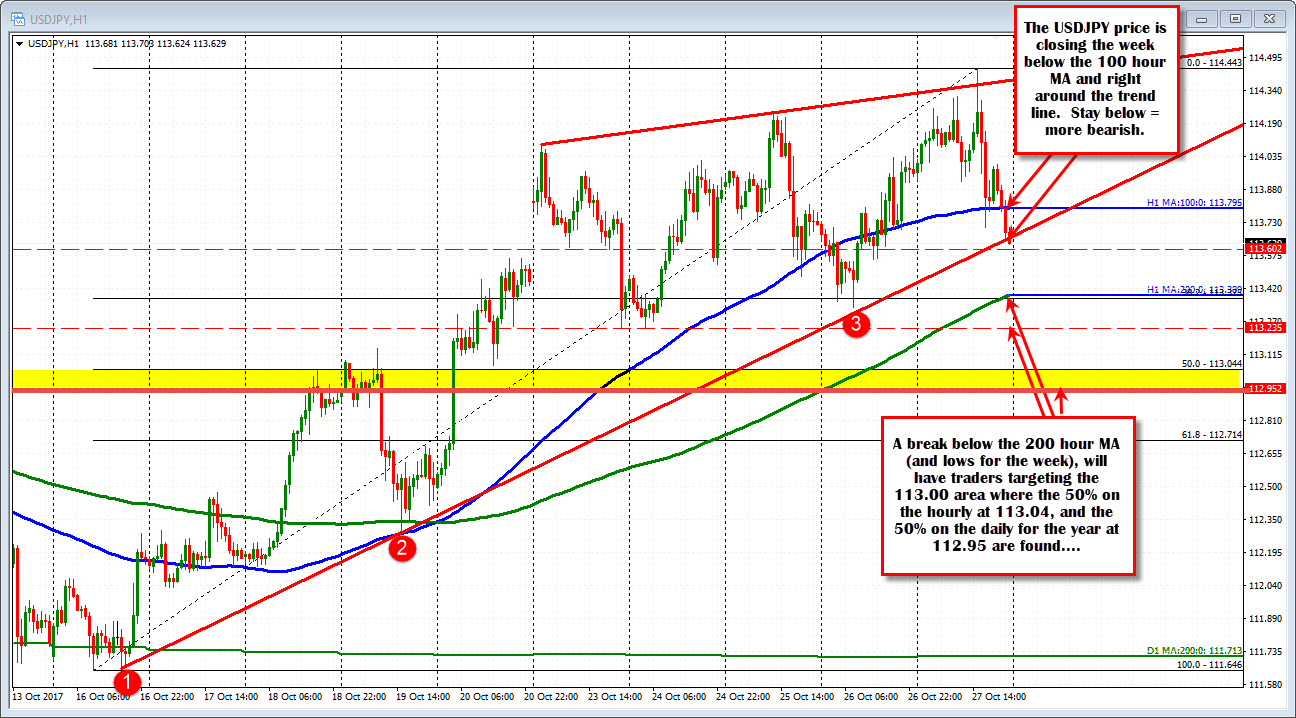
Drilling to the hourly chart below, the pair is closing the week below the 100 hour MA at 113.795 and right around a trend line (the prices go wide at the end of the week, so imagine the close for the week, being right on that trend line). Those levels will be close resistance and help define the early bias. Stay below, more bearish. Move above, more bullish with a break higher looking back toward the swing highs for the week.
On the downside, the 200 hour MA (green line) comes in at 113.399 (and rising). If the price goes below that MA, it will also be a more bearish bias clue. A break below is more bearish and will make the retest of the 50% from the daily at 112.95 more likely. PS the 50% off the hourly comes in at 113.04. So make 113.00 a key support area in the early part of the week.
The fundamentals support a higher dollar (I would think). The yields are at a cross roads though and so are the technicals on the USDJPY chart. As a result, there is a little pause and depending how the wind blows will control how the pieces all come together. The good news is there are some pretty definitive levels that should give bullish or bearish bias clues. Use them to your trading advantage.

