Gold up on tensions but can the gains be sustained
Gold is trading up about $11 on the global tensions with No. Korea.
The move higher has taken out the high for August at 1274.20 (high reached 1276.50), but has stalled ahead of the next target at the 61.8% retracement at 1278.26 (see daily chart below). The price currently trades at $1272.

Technically, the move has shown some bullish tendencies (even before today's headlines).
Looking at the daily chart, the price moved above its 100 day MA (blue line on daily chart currently at 1253.76) on July 21st. The price dipped below that MA line on July 26th, but rebounded by the close. On Friday and again on this week the lows stalled near that MA level and found support buyers.
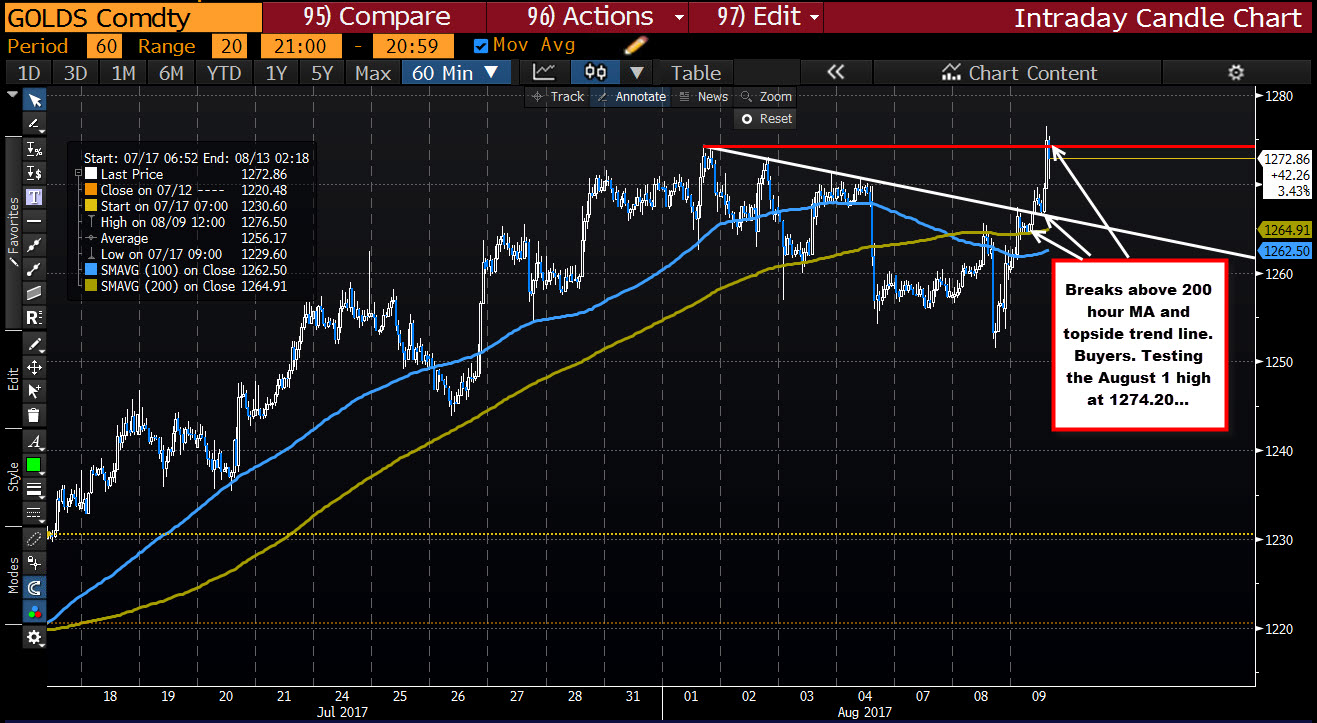
On the hourly chart, the price action today has pushed above the 100 and 200 hour MAs (blue and green lines on the hourly chart above), and a topside trend line (that trend line was successfully tested as well). The price surge has moved above the August 1 high at 1274.20 but is consolidating above and below that level now. If the price is to go higher, look for a move back above 1274.20 with the 1278.26 as the next upside target (61.8% retracement on daily). Above that and the all important $1300 will be eyed.
Where is the risk for the longs now?
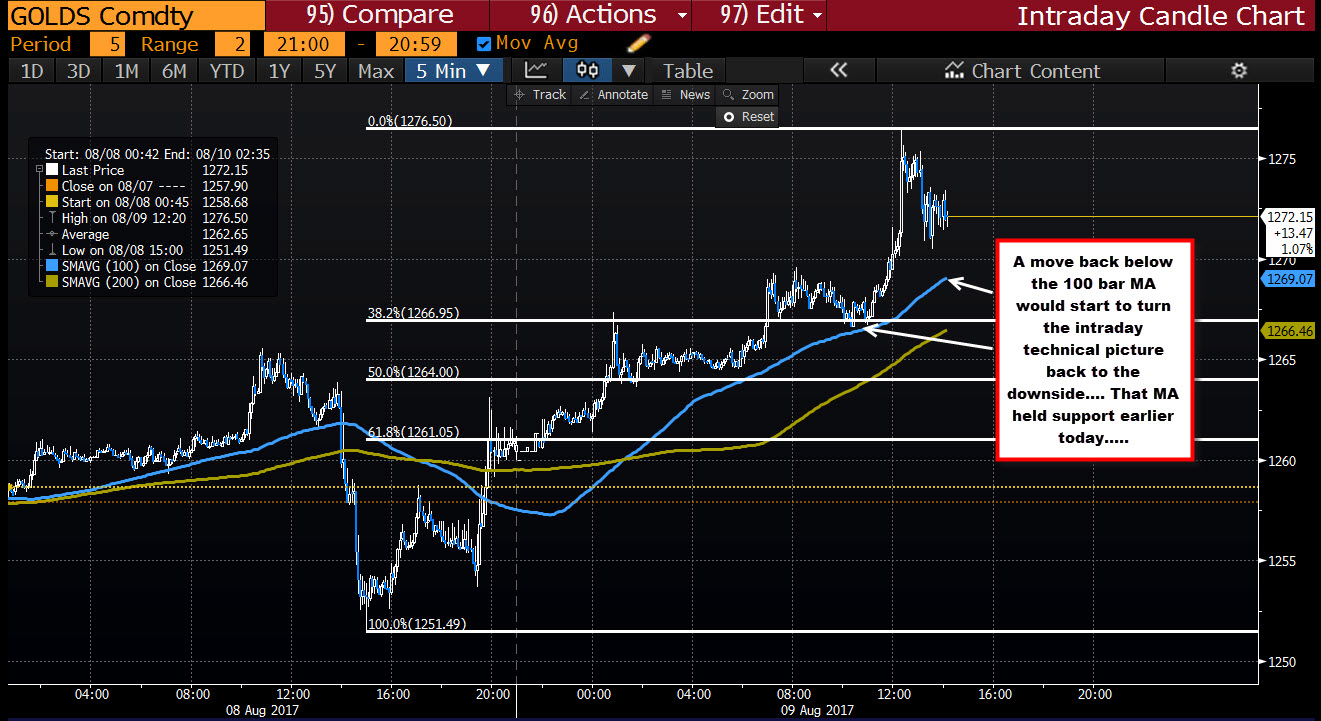
Drilling down to the 5 minute chart below, the 1269.07 is the 100 bar MA on the 5-minute chart (see chart below). That MA was tested on the move higher today and bounced. A move below would be a negative for the buyers intraday. The 200 bar MA is following behind at 1266.46 currently (both MAs are moving higher). Breaks muddy the water for the bulls and could signal a turning back to the downside.
For the time being though, the buyers remain more in control... technically.