
Australia employment due out at 9:30 PM ET/0130 GMT
The Australian unemployment report August be released at 9:30 PM ET/0130 GMT. The following is expected:
- Employment change 20 K versus 27.9 K last month
- unemployment rate 5.6% versus 5.6% last month
- full-time employment change last month came in at -20.3K
- part-time employment change came in at +48.2 K last month
- participation rate 65.1% estimate versus 5.1% last
Those are the details of the expectations.
What are the technical saying?
The bias today has moved lower and in the process turned the bias a little more bearish. The move is more USD related. The dollar is rising in trading today and that has helped to push the AUDUSD lower through some technical levels. On the release of the report, the market will be focused on what is happening in Australia. That could reverse the bias if the numbers are more bullish (i.e. stronger).
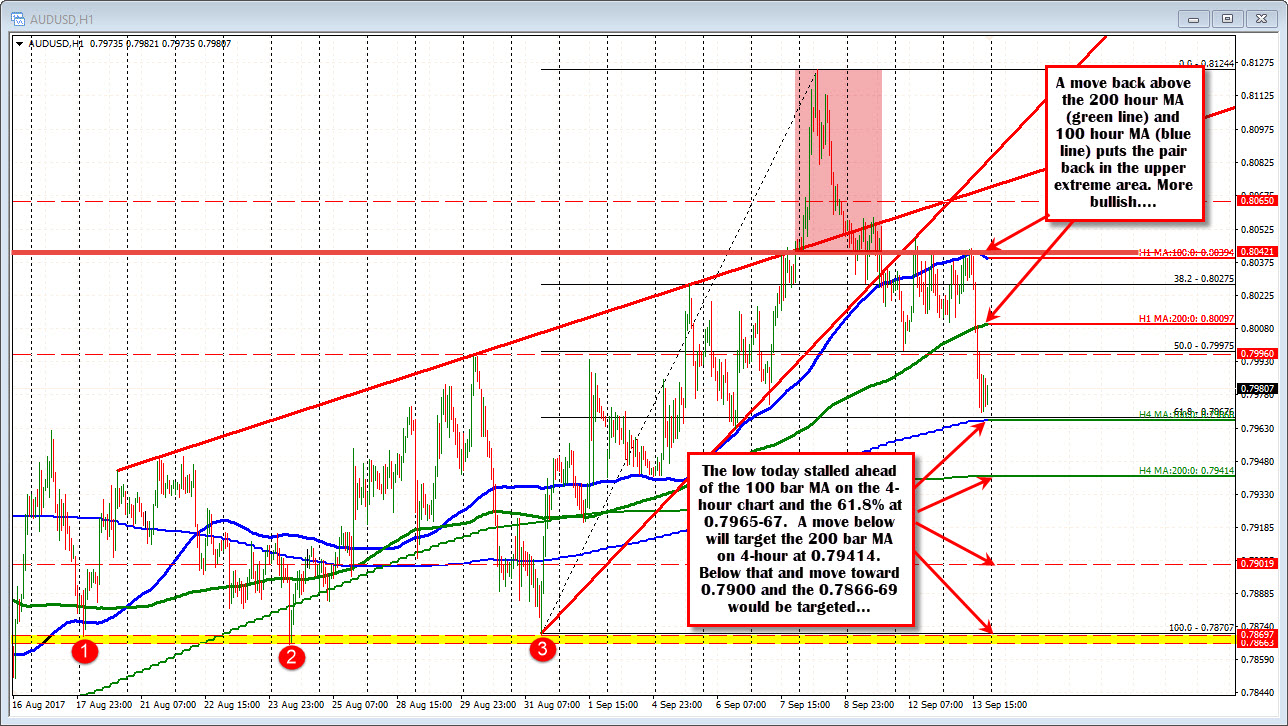
Technically, looking at the hourly chart above, the price today stalled against the 100 hour moving average (blue line in the chart above) at 0.89394, and started to move lower helped by the stronger US dollar.
The price action saw the pair fall below the 200 hour moving average (Green line in the chart above) at the 0.80097 level. That opened the door for further declines and the 50% retracement of the move up from the August 31 low was broken at 0.79975 (call it a break of 0.8000)
Ultimately, the pair found support near the 61.8% retracement of the move up from the August 31 low. That level comes in at 0.79676. The 100 bar moving average on 4-hour chart is also near that level at 0.7965. The low for the day reached 0.79699, just above those support targets. All those levels are important through the employment report.
Going into the release, on the topside, the 0.8000 level and then the 200 hour MA at 0.80097 will be the first upside targets on a more bullish number (i.e. stronger than expected employment change, higher full time employment, lower unemployment rate).
A move above those levels will reverse some of the bearishness seen in the NY session and next target the 100 hour MA at 0.80394 (blue line in the chart above). That is where it all started in trading today. A move above that level and the highs for the day will open the door for further upside momentum. It would refute what looks like a head and shoulders formation. To get back to that level would require about a 65 pip move. That is not a long way. So be aware.
On a weaker than expected number, the 61.8% and 100 bar MA on the 4-hour at 0.7965-67 are the first levels to get below.
On a break of that level the 200 bar MA on the 4-hour at 0.79414 will be eyed. On Sept 1, that moving average was tested and held.
A break below it, will look toward the 0.7900 and then a series of swing lows in the 0.7866-697 area (yellow area in the chart above).
Just to give you an idea, from the current level a move toward that triple bottom would be about 110-120 pips. Needless to say it is a larger move than the corresponding move higher, but it too is trek that could happen IF the number is weak.
The levels are set. It is up to the number now. WIth the price near the middle of the most recent range, there is the potential to make a run to extremes on strength/weakness. So look for the surprise, and if it comes, trade the breaks and look for the momentum. ON an as expected number, expect choppy trading conditions.

