
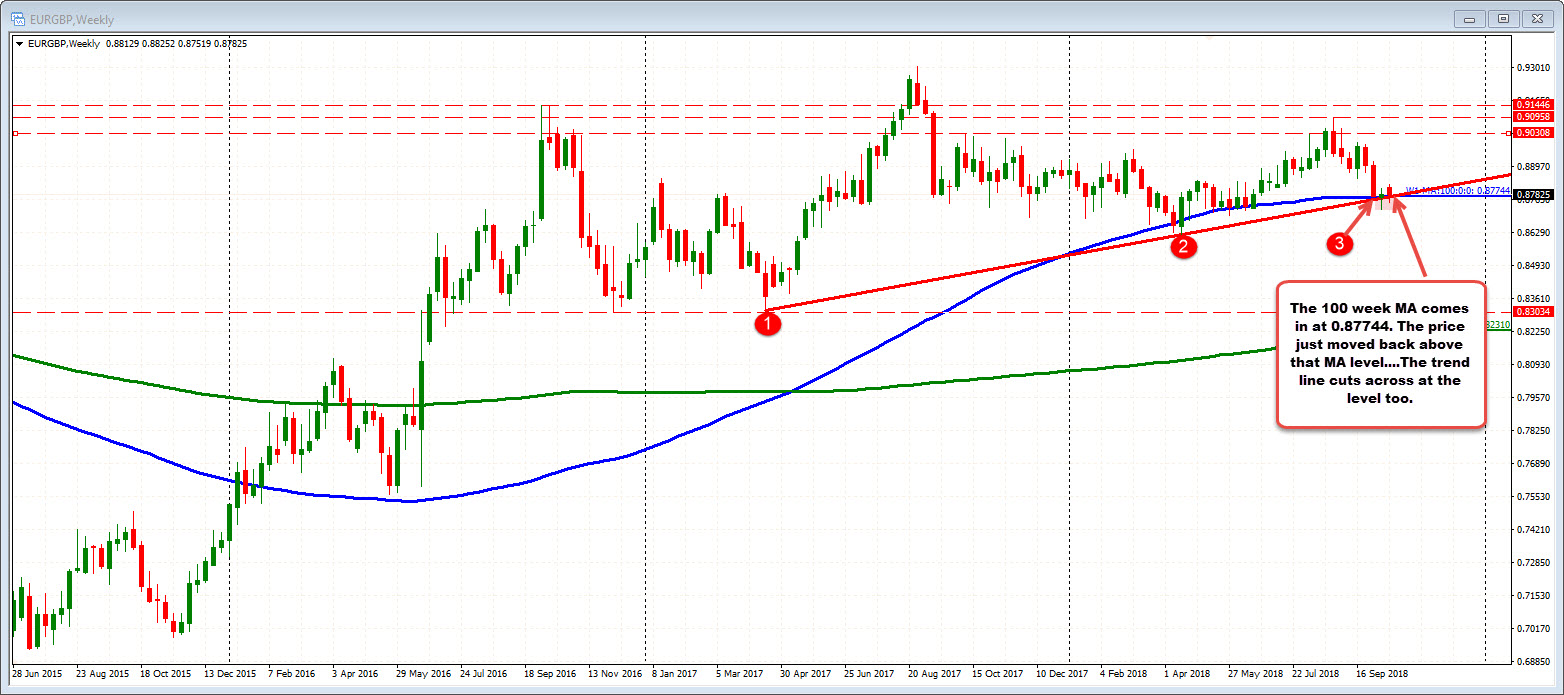
Also back above 100 week MA
The EURGBP moved lower on the back of better wage data today (mostly). That move, took the price of the pair back below its 200 hour MA.
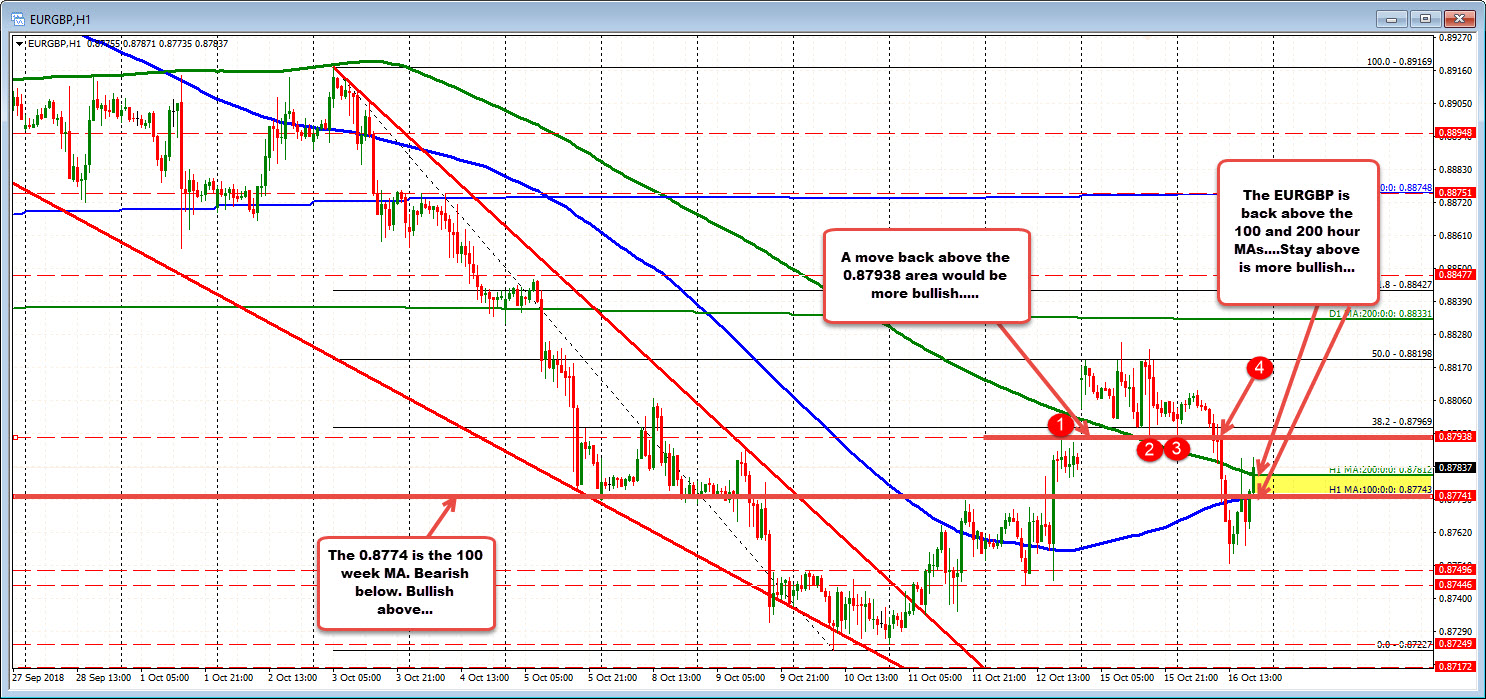
Yesterday, the pair gapped above the MA level (green line) on the back of more bearish weekend Brexit news. Today that gap was filled (at 0.8793) and broken, along with the 200 hour MA (green line at 0.87812 currently).
The bearish breaks, sent the price lower. The 100 hour MA (blue line was broken - currently at 0.87743). The low stalled ahead of the Friday lows. The low today reached 0.8752. The lows on Friday extended down to 0.87446.
The rebound off the lows, has just moved the pair on the hourly chart back above the 200 hour MA (green line) That is more bullish. Admittedly, the pair moved above that line earlier in the NY session but that break quickly faded. Traders - looking for more upside now - will want to see the 100/200 hour MA area at 0.87743-812 hold support now. Stay above is more bullish. Move below, and the bias tilts back to the bearish side. Key area (yellow area in the chart above).
What makes the area even move important is if you look at the weekly chart below, the 100 week MA is at the 0.87744 area (that is the 100 hour MA as well). A trend line cuts across at that level too.
The price has been trading above and below that 100 week moving average the last few weeks (see blue line in the chart below). Sellers and buyers have been battling it out. That battle is still going on. However, if the price can start to move away from that MA now (after the failed break below), more buyers may look to jump on that move.
So for traders, this is a key break that may help to determine the trading bias going forward.
What are targets on a more bullish run?
If the 0.8774 area can hold support and the price momentum build,
- The 0.87938-969 (38.2% on the hourly chart above) will be the next target to get to and through. That area was a floor until broken today.
- Above that, the 50% of the same move down at 0.88198 will be targeted, followed by
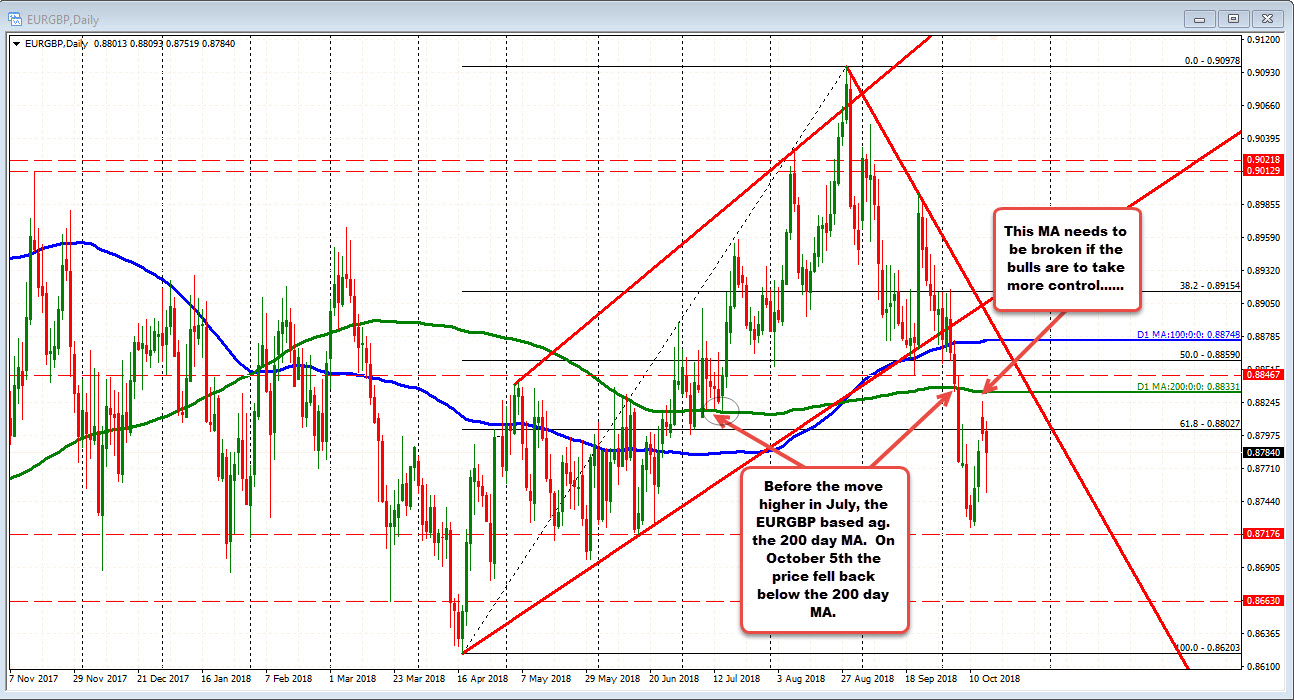
- The 200 day MA at 0.8833.
Looking at the daily chart below, the 200 day MA was broken on October 5th. Back in July, the MA was a base before moving higher. If that MA can be broken to the upside, that would be another positive hurdle for the bulls.
SUMMARY. Key time for the EURGBP. IF the 0.8774 level can now hold support, the pair has a chance to build off that level. If not, the bias tilts back to the bearish side.

