
The EURUSD has traded most of the week below the close from last week
The EURUSD closed last week week at 1.22159. The price initially fell on Monday to a low of 1.21315 and formed a bottom between that level and 1.21364 on Tuesday before moving higher, and retesting the close from last week. The high for the week on Wednesday reached 1.2222 just 6 or so pips from the closing level last week before rotating lower.

A mid range ceiling this week was developed near the 1.21784. That was where the price peaked yesterday. There were also swing highs on Tuesday and Wednesday near that level.
Keep that level at 1.21784 in mind going forward. Admittedly there are other levels that would need to be broken before getting there, but the move lower from that level yesterday (and the prior peaks near that level - see red numbered circles), makes it a key level should the price action reverse higher).
The fall lower today cracked below a lower trendline connecting Monday and Thursday's lows. That trendline cuts across at around 1.2100 currently (and moving lower). If the price is to go higher, getting above that trend line is the first target on the topside.
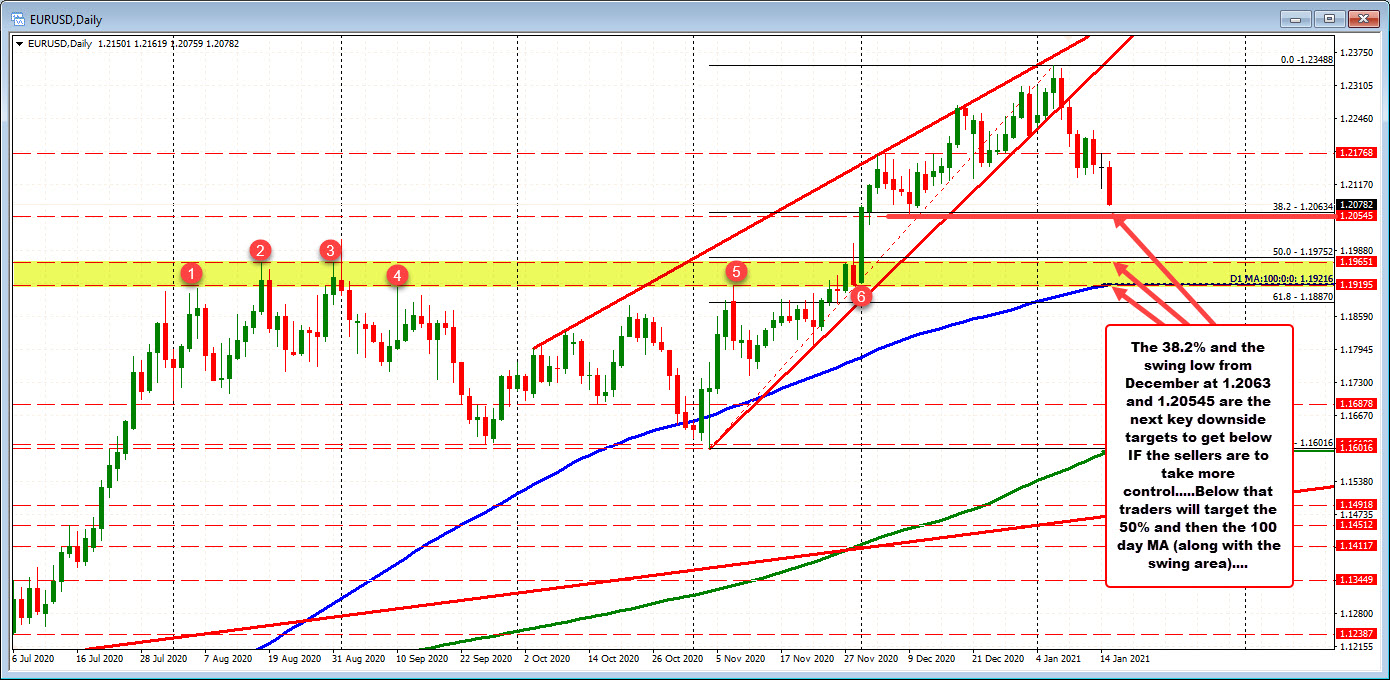
Taking a look at the daily chart, the move lower over the last few weeks has now taken the price closer to the 38.2% retracement of the move up from the November low to the December high. That level comes in at 1.20634. From a technical perspective getting below that 38.2% retracement is the minimum if the sellers are to take some control back from the buyers after the move higher from November low. Getting below is simply step 1. The other steps would be to get below the 50% retracement of the same move higher at 1.1975 and the 100 day moving average at 1.19216 and moving higher. The last time the price traded below the 100 day moving average was on November 4, 2020.
Summary: For the week and in the intermediate-term, the sellers are more in control. However, looking at the daily chart, there is more work to be done to turn the bias on that chart more to the downside.

