
Trades near unchanged on the day
While stocks tumble lower and yields move to the downside, the price of gold has been relatively steady.

The price has been trading above and below unchanged. The price is currently up about $1 or or 0.06% at $1903.14. The high for the day reached $1908.59. The low was at $1891.38.
Looking at the daily chart above, the price remains above the 100 day moving average below $1883.54. The low from September tested that 100 day moving average only to find buyers against the level. If the price is to go lower, getting and staying below that moving average would be a key technical break. Until then, buyers stay in the game and with control from the daily chart perspective.
Drilling to the hourly chart below shows the up and down non-trending dynamics in the price action of late. The 100 and 200 hour moving average is moving sideways and close to each other. The 100 hour moving averages at $1909.69. The 200 hour moving average is at $1906.63. The high price today stalled between those two moving averages. From that perspective, the biases a little more in the favor of the sellers.
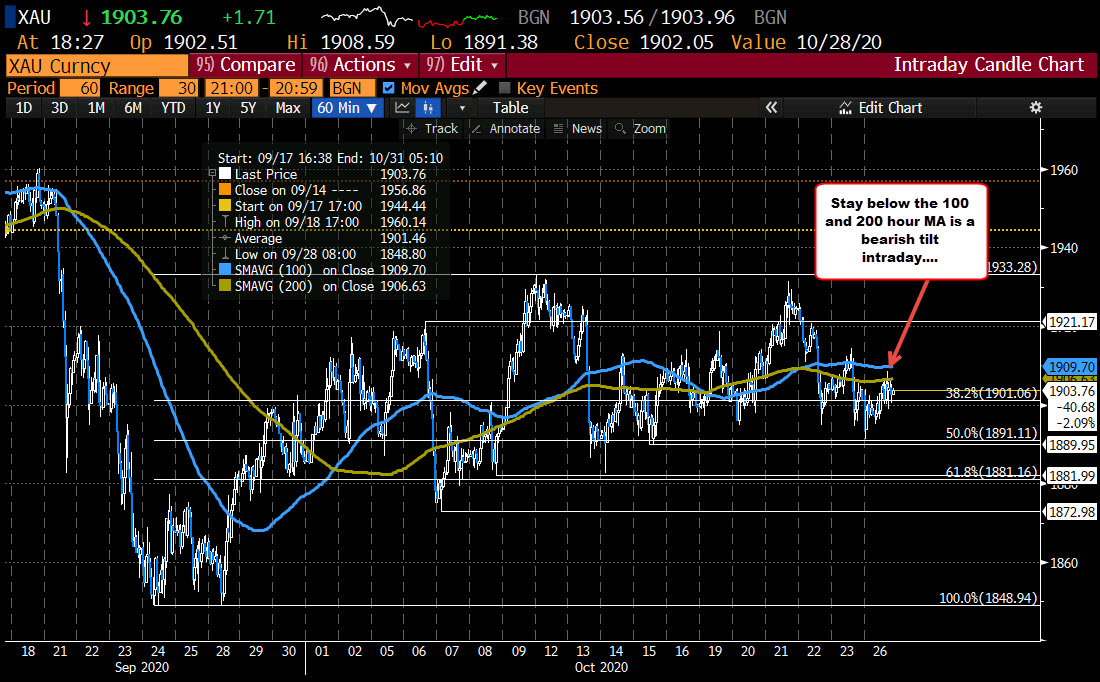
Note: the low price today stalled near the 50% retracement of the range since the recent bottom on September 24. That level comes in at $1891.11.
So although the daily chart is in the favor of the buyers above the 100 day moving average, the hourly chart is slightly negative below the 100 and 200 hour moving averages. Watch for a move above the $1909.70 level to increase the bullish bias. On the downside moved below the 100 day moving average at $1883.54 would be more bearish.

