The bottom this week was a good one.
The DXY index (dollar index) formed a real nice bottom in trading this week.
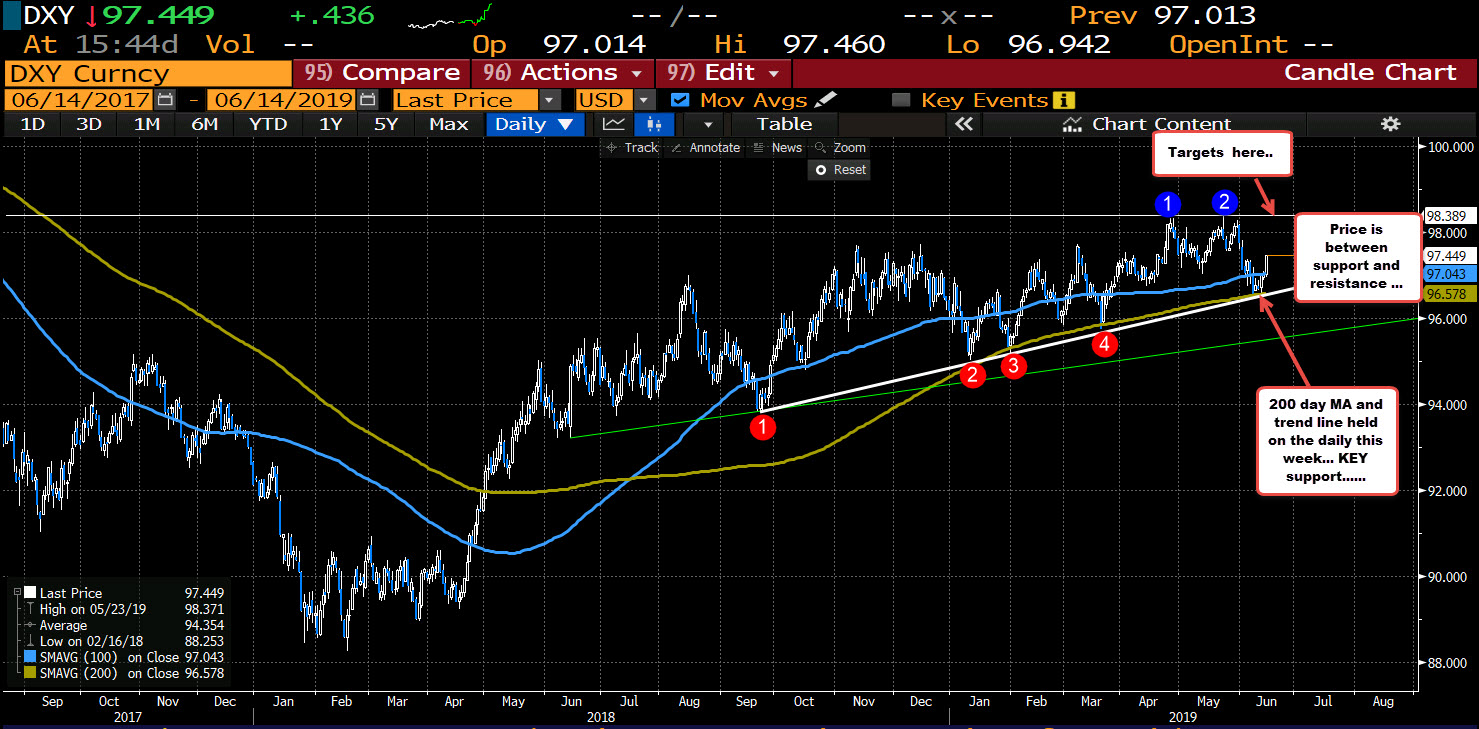
Looking at the daily chart, the low this week stalled near the 200 day MA (green line in the chart above) AND a nice trend line as well. Holding was bullish. Buyers leaned against the level. Today the price moved above the 100 day MA (blue line) at 97.043.
The US data rewarded the support buyers with a run higher today helped by the better retail sales/industrial production data. GDP estimates were raised with some estimates now at 2% (and above) for the 2Q.
What next?
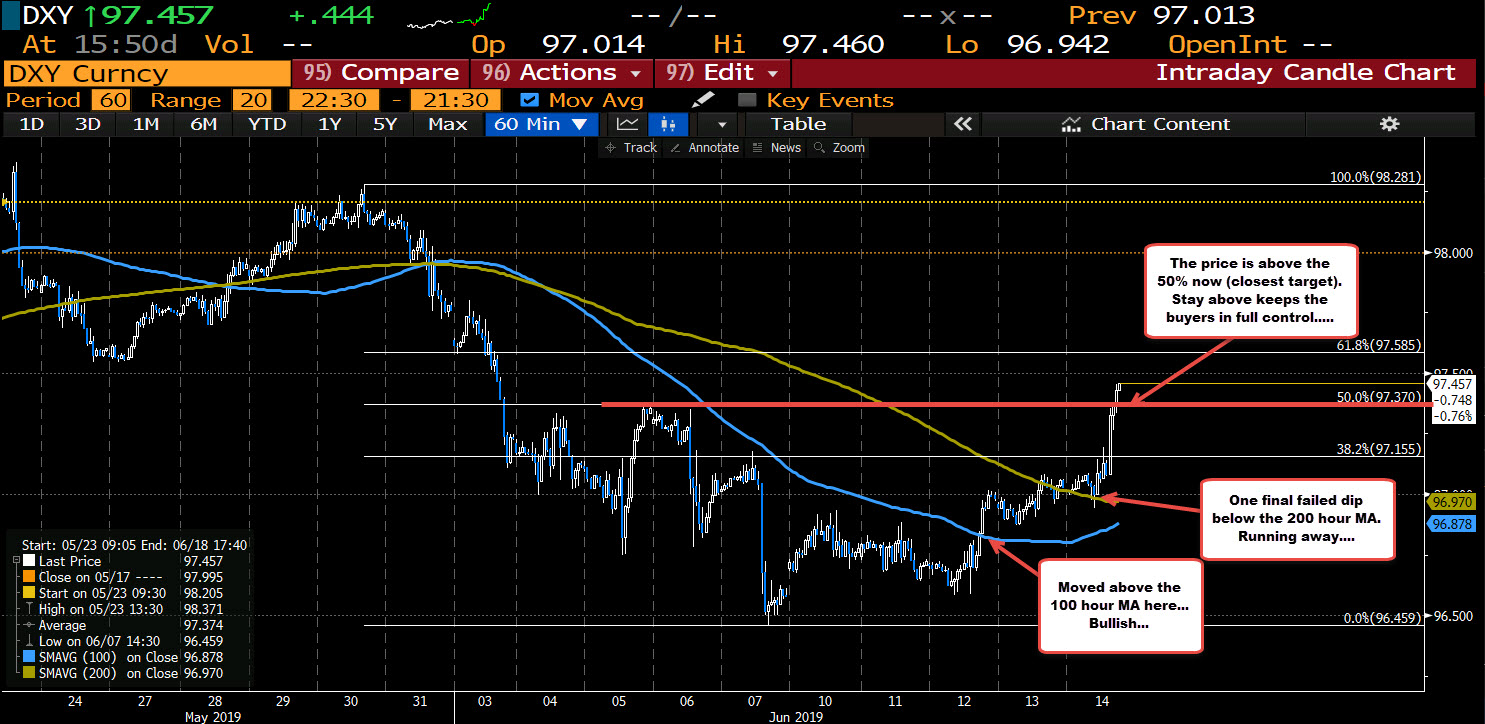
Drilling to hourly chart, the pair is now trading above the 50% of the move down from the May 30 high. That comes in at 97.37 and will be close risk for longs. Stay above keeps the buyers firmly in control. The 61.8% of the move down come in at 97.585. A move above that, and traders will start to eye the ceiling highs from the daily up at the 98.28 to 98.38 area.