
What levels are in play for some of major currency pairs
EURUSD:

The EURUSD trended higher in the Asian and into the European session and in the process moved above the high from last week at 1.16238 and the high from October 4 at 1.1640. However, the pair stalled at 1.16687 which was a few pips short of the 38.2% retracement of the move down from the September 3 high at 1.16705.
The current price is trading at 1.1635 below the hold a color high at 1.1640.
The inability to get above the 38.2% retracement keeps the sellers in play. Stay below the 1.1640 level would give the sellers even more confidence. On the downside a break of the 100 hour moving average at 1.16073 (and moving higher would increase the selling pressure with the 200 hour moving average at 1.1583.
If the price can get and stay above the 1.1640 level, the 38.2% retracement target still remains a minimum retracement level that traders would need to get above if the buyers are to take back more control from the sellers. Absent that, and the buyers may be winning a battle, but they aren't winning the war.
USDJPY:
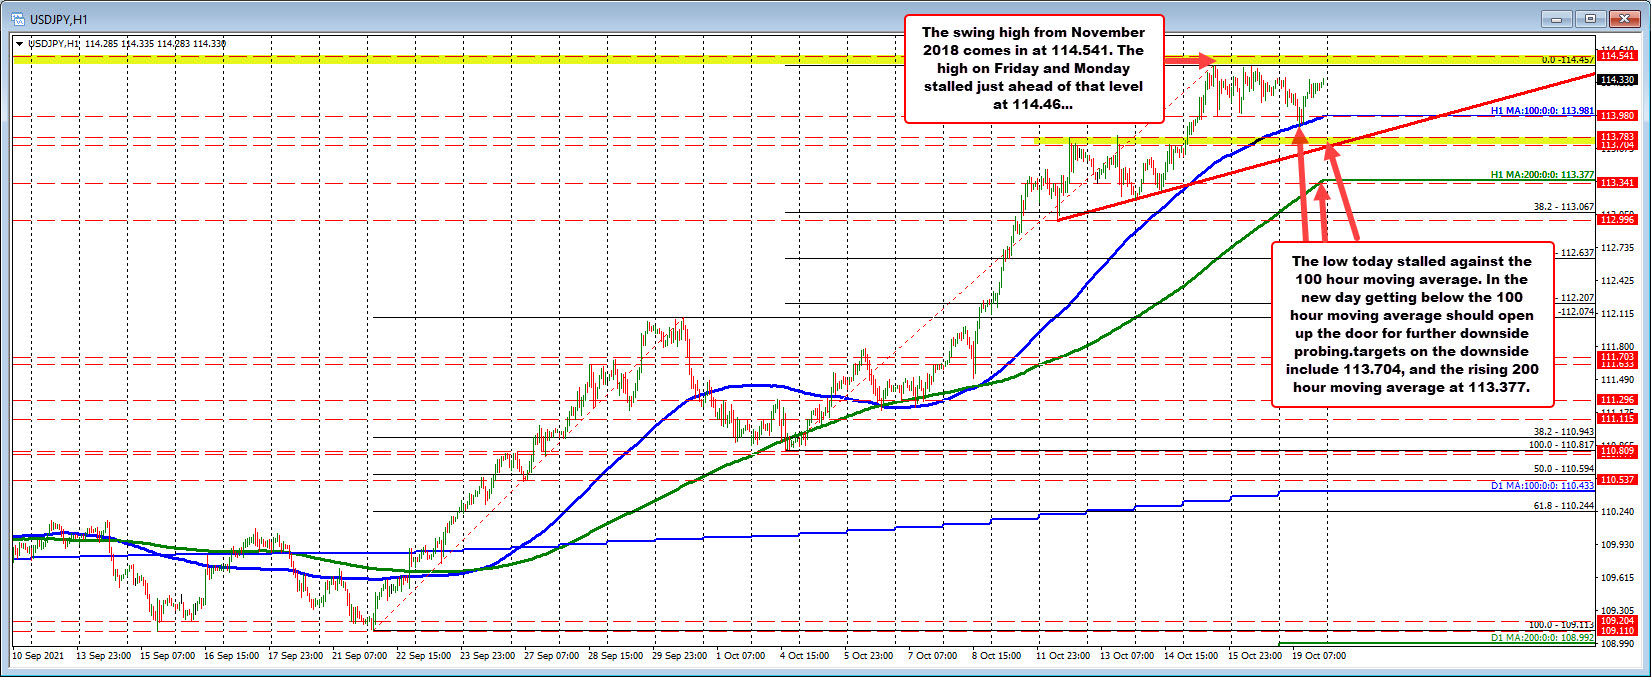
The USDJPY is trading near unchanged on the day, and has waffled up and down in a relatively narrow range between 113.87 and 114.457 over nearly 3 days. The current price is trading at 114.329.
Other important technically is at the low today bottomed right near its 100 hour moving average which is currently rising at 113.981. It still takes a move below (and staying below) that moving average to increase the bearish bias. Absent that and the buyers are still in firm control
On the topside the 114.54 level represents the high price going back to 2018. If broken, the November 2017 high price at 114.728 will be the next target.
GBPUSD:
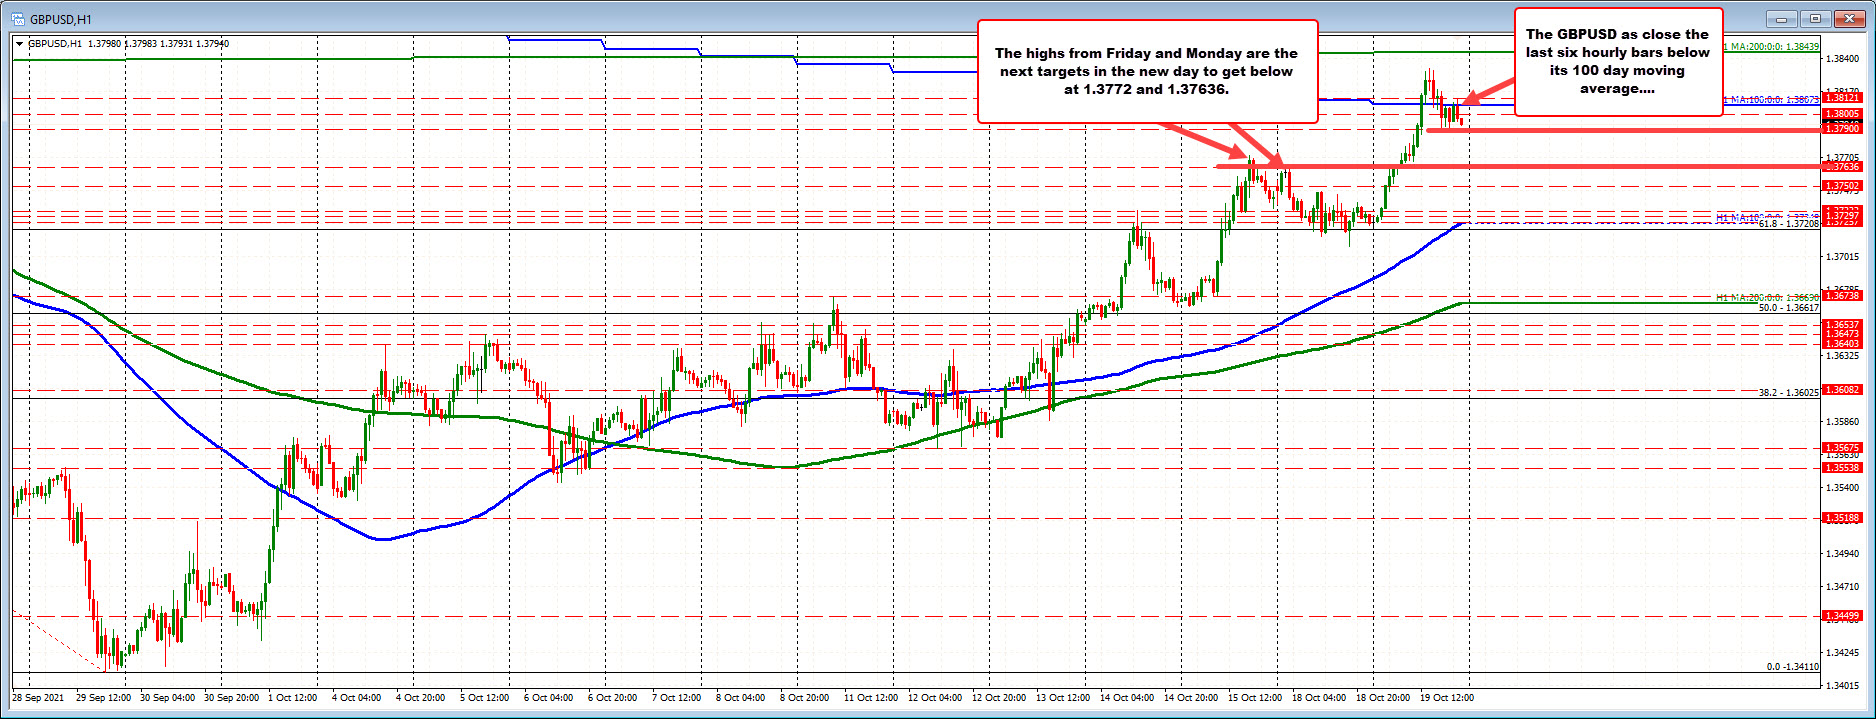
The GBPUSD trended higher today and opened the North American session above its 100 day moving average at 1.38079. The high price reached 1.38331. The high price fell short of its 200 day moving average at 1.38439.
The rotation to the downside in the New York session took the price back below the 100 day moving average. The last six hourly bars have closed below that moving average level at 1.38079. The current price is trading at 1.3795.
In the new trading day, as long as the price can remain below the 100 day moving average, there is room for further corrective downside probing with the high from Friday at 1.37725, the high from Monday at 1.37636 as the next downside targets to get to and through.
A move back above the 100 day moving average with momentum opens the door for a move toward the September high at 1.39123.
AUDUSD:
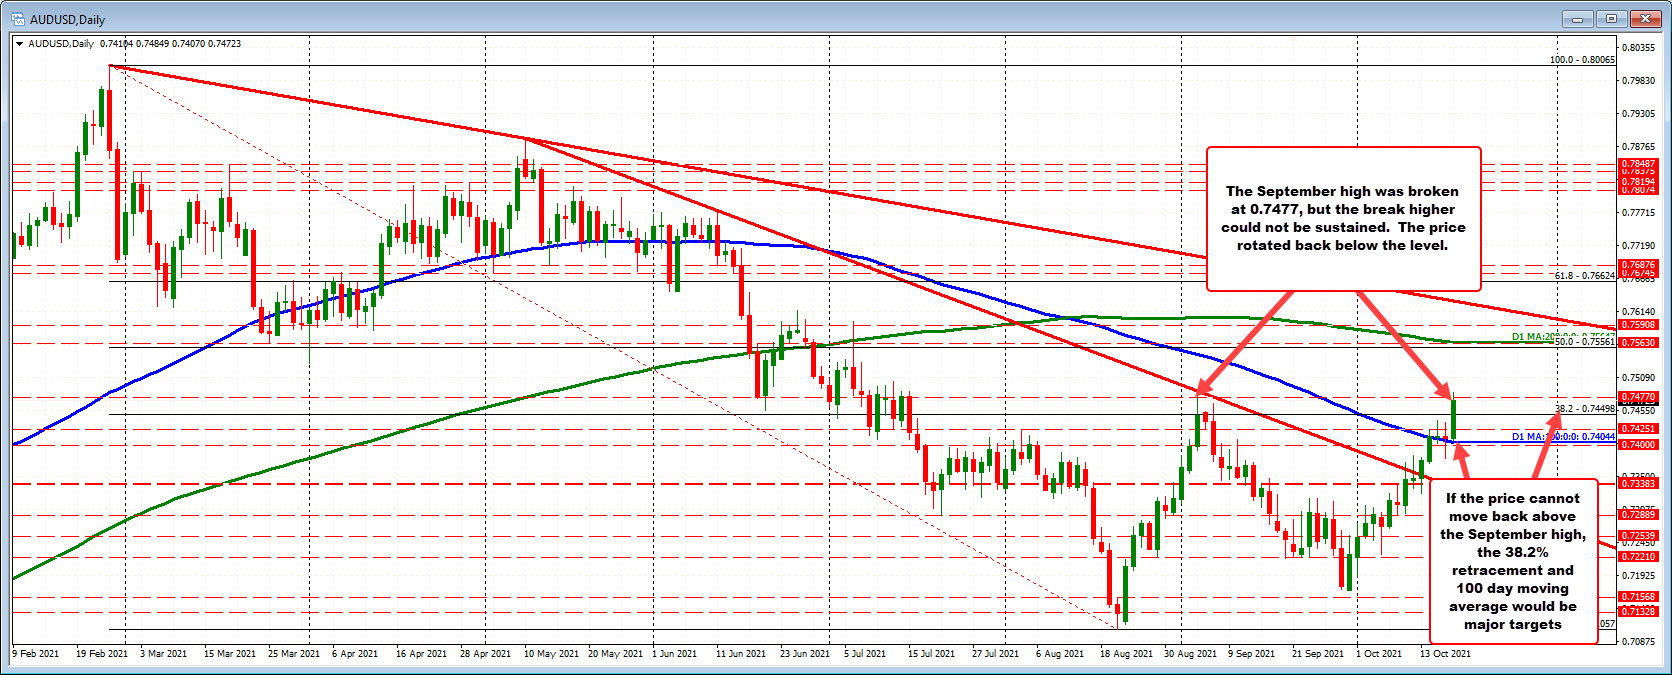
The AUDUSD moved above the September high at 0.7477 to a new high of 0.74849. That was the highest level going back to June 13, 2021. The break above that level has seen some sellers and the price currently trades back below that old high at 0.7473. In the new trading day getting and staying above the 0.7477 level would open the door for further upside momentum momentum.
Stay below and the 38.2% retracement of the move down from the 2021 high comes in at 0.74498. That level would be targeted and eyed for potential support. A break below and we could see a rotation back toward 0.7425 and then the 100 day moving average at 0.7404.
USDCHF:
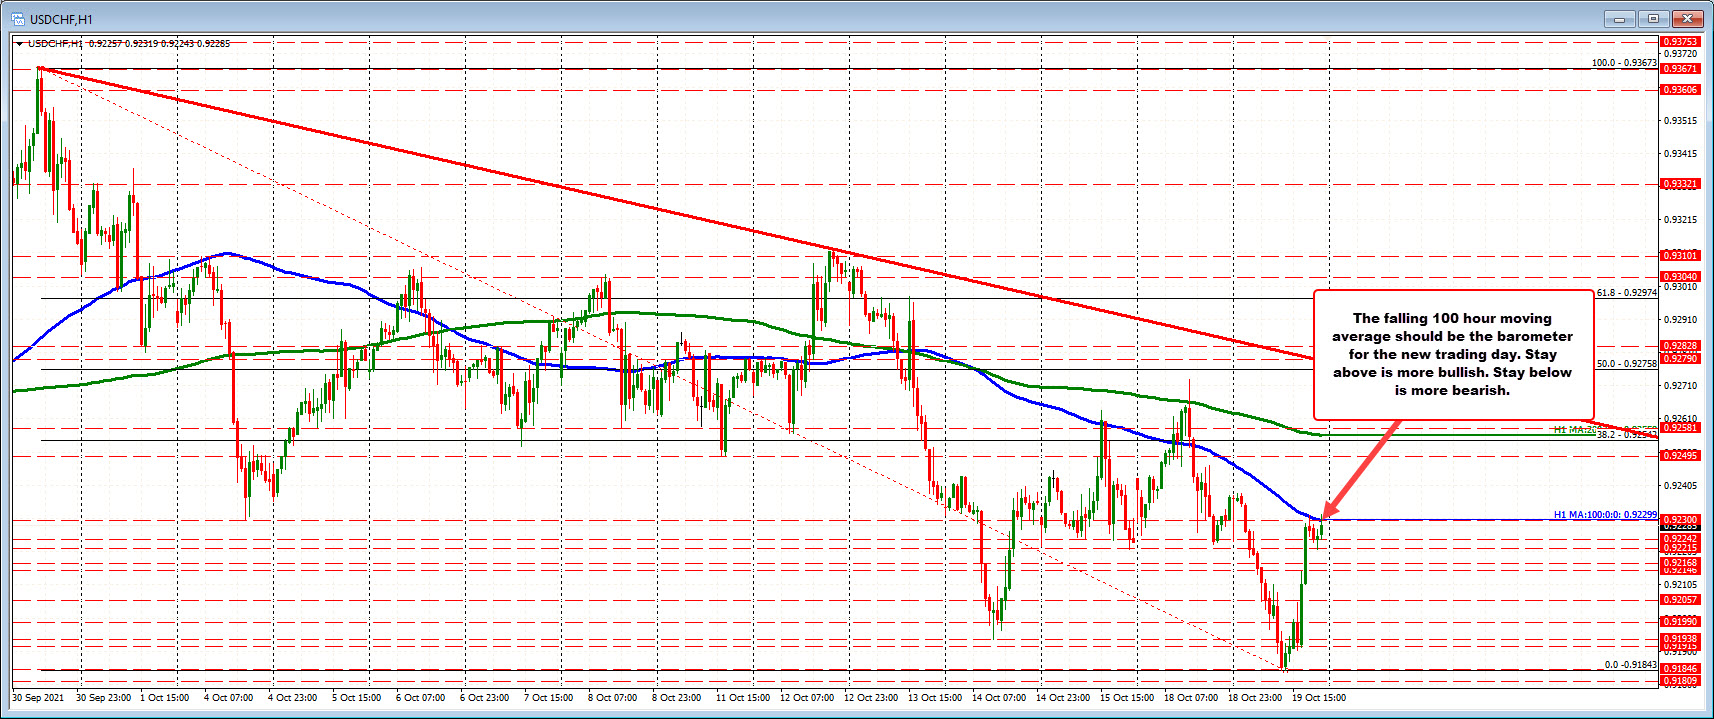
For the USDCHF, it is all about the falling 100 hour moving average at 0.92299 in the new trading day. The price action on Tuesday saw the price initially moved lower and then snapback higher in the US session. However the 100 hour moving average did stall the rise with a modest correction off that level.
The current price is trading at 0.9228 which is just a pip or so off the moving average level. Traders will use that moving average as a barometer for buyers and sellers in the new trading day. Move above is more bullish. Stay below is more bearish

