
The range over the last 7 days in the USDJPY is 109.52 to 110.129
The USDJPY is mired in a sideways up and down trading range over the last 8 trading days.
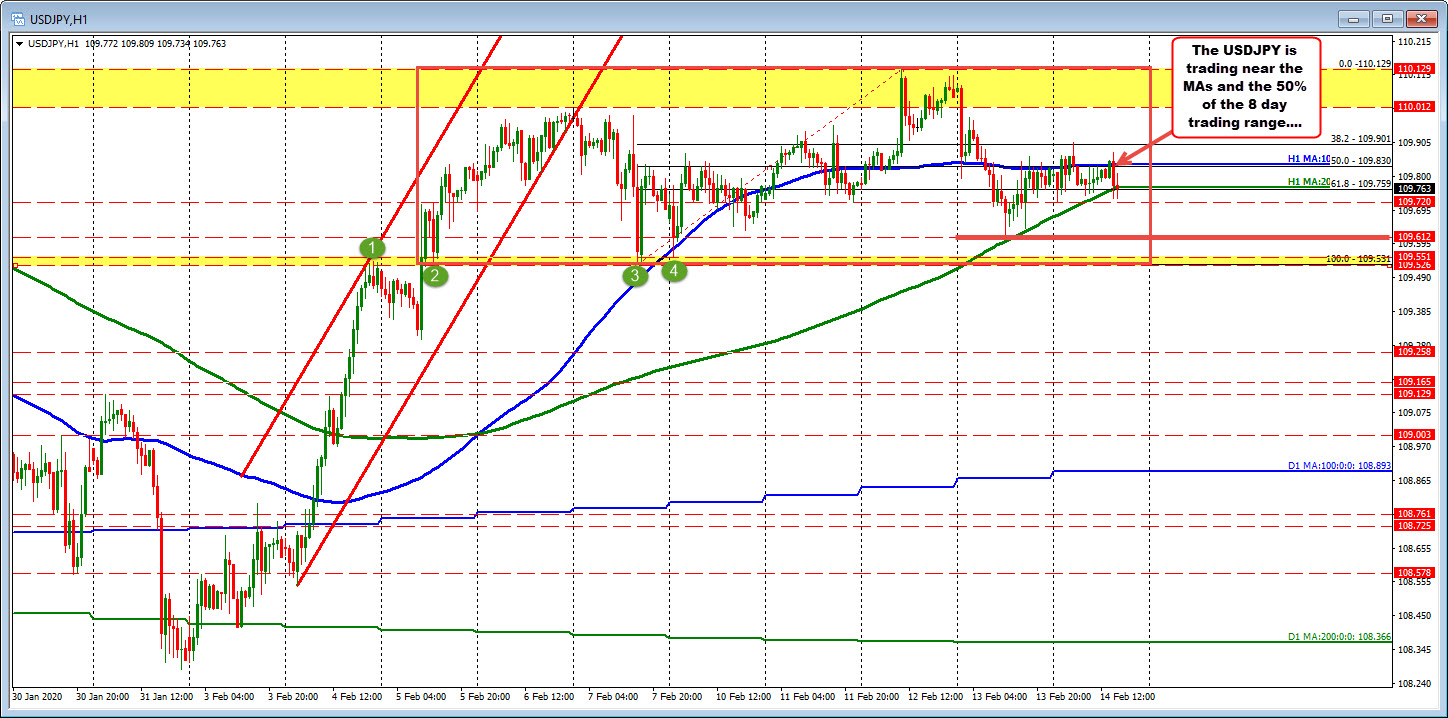
The low over that period came in at 109.525 from February 7. The low this week was just above that level at 109.551 on Monday. Thursday's low reached 109.612.
The high over the last 8 days came in on Wednesday at 110.129. That move higher took out the high price from February 7 at 110.012.
The midpoint of the range comes in at 109.828. The current price is trading at 109.76. The 100 hour moving average comes in at 109.84. The 200 hour moving average comes in 109.759. The price on Thursday stayed just above that 200 hour moving average on dips. With the 200 hour moving average moving higher and toward the 100 hour MA, the market has little room to room around the technical levels.
It is getting time for the pair to make a move. Look for a shove. At some point the price will move from the MAs/50% and also extend outside the narrow range.
Taking a broader look at the daily chart, the price high this week fell short of the high price from January at 110.283. On the downside the price action in the range as trade above and below the November and December high prices at 109.66-68. However, there has not been a close below those levels. The price remains above the 61.8% retracement of the move down from the April high at 109.352.
Overall, the pair is trading nearer the 8-9 month highs, but it is not running. Like on the hourly chart, the price action from the daily chart is saying "Give me a shove one way or the other".


