
A closer look at the correlation between the two
Why brothers?
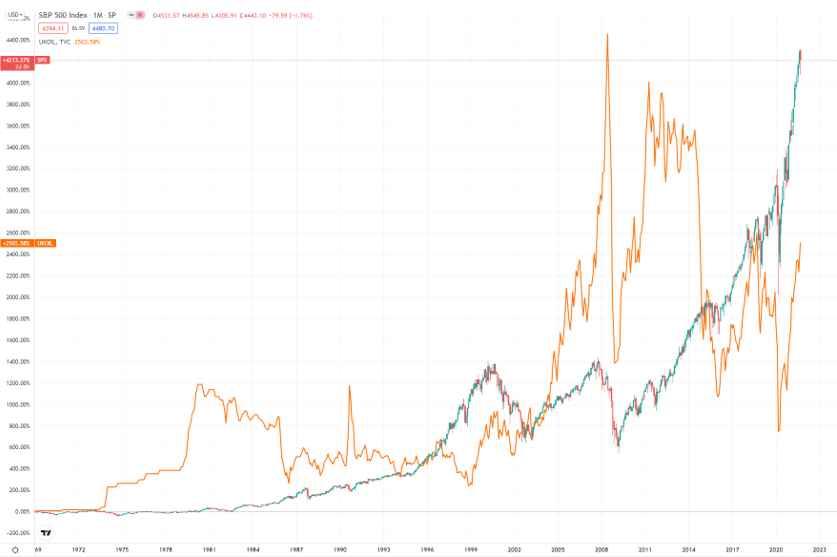
If you put an oil chart on the S&P500 chart, you will find out that these assets have a strong correlation.

This happens as oil growth is usually caused by an increasing supply, which gets provoked by high economic activity. The current situation does not look similar as an extreme Brent price growth was caused by supply chainproblems and nature cataclysms. However, it seems that the global rally is not over, and markets are on the wedge of another growth wave in November.
Why so positive?
Brent (XBR/USD) monthly chart

Brent looks extremely bullish on the global chart. And when if not now the pump should finally happen? The macroeconomic situation is conducive to the continuation of the trend, as as the demand for oil will constantly grow during the global economic recovery from the pandemic.
On the monthly chart, Brent is now breaking through the falling wedge. We expect that the trend will continue as September's candle looks significant. Moreover, you can see that bullish divergence occurred with the RSI chart.
S&P500 (US500)
The current correction on the stock market was caused by the risks of key rate increase. An increase in rates can negatively affect the growth of quotations, but no one has a clue when the rates are going to be finally increased. According to the latest information it might happen in 2022, but no exact dates were announced.
Moreover, the current correction is accompanied by large-scale buybacks from companies, which buy their stocks. And it looks crazy to buy stocks at the very top of their price, right?
Lately in 2021 S&P500 FAANG companies were the main driver of the US main index. According to FBS's Facebook stock analysis, we are ahead of the 5th wave of market growth in 2021. It can happen during the New Year Rally. In the last year, S&P500 gained 11% in November and 4% in December. As we have mentioned before in our historical US market analysis, November and December are the most successful months for the US500 index.
Technical analyses
XBR/USD, daily chart

XBR/USD came to the overbought zone according to the RSI. It got down from $80 resistance level lately. The price needs to confirm the previous local high breakout, that's why I expect a $77.3 level retest. If the price breaks through this level, the next support will be at $75.
After the retest, the rally will continue with the target at $85.
US500, daily chart

The second wave of this correction began, and according to the wave theory, it should be the same size as the first one. In this case, the target for US500 is 4250.
In long term, the target for US500 is 5300.
You can trade the US500 index with FBS. Also, a great option is to trade FAANG stocks, which usually overperform the main US index.
You can trade oil and indeces with FBS in FBS Trader app or Metatrader 5.
Disclaimer
This post is written and submitted by FBS Markets for informational purposes only. In no way shall it be interpreted or construed to create any warranties of any kind, including an offer to buy or sell any currencies or other instruments.
The views and ideas shared in this article are deemed reliable and based on the most up-to-date and trustworthy sources. However, the company does not take any responsibility for accuracy and completeness of the information, and the views expressed in the article may be subject to change without prior notice.

