.png)
So often, a good trading plan is ruined by sub-optimal execution. Sometimes we can identify great trends with strong underlying fundamentals, only to join the trend when it's about to end. Other times, we try to pick the best possible spot for an entry, and price carries on its merry way without us.
Sometimes we actually get on board a great move, and hold on to the trade expecting a multi-day or multi-week move, only to see price retrace some or all of the path it had covered in our favour.
These are all very frustrating situations. In this article we shall explore how a simple indicator, based on the Average True Range, can help us solve these dilemmas in a logical, consistent way. We shall explore how ATR can help you:
-enter trades with more ease
-manage trades with confidence
-measure trend strength systematically
What is ATR?
Simply stated, the Average True Range is a measure of volatility. It tells you how far, on average, price travels during a given time period.
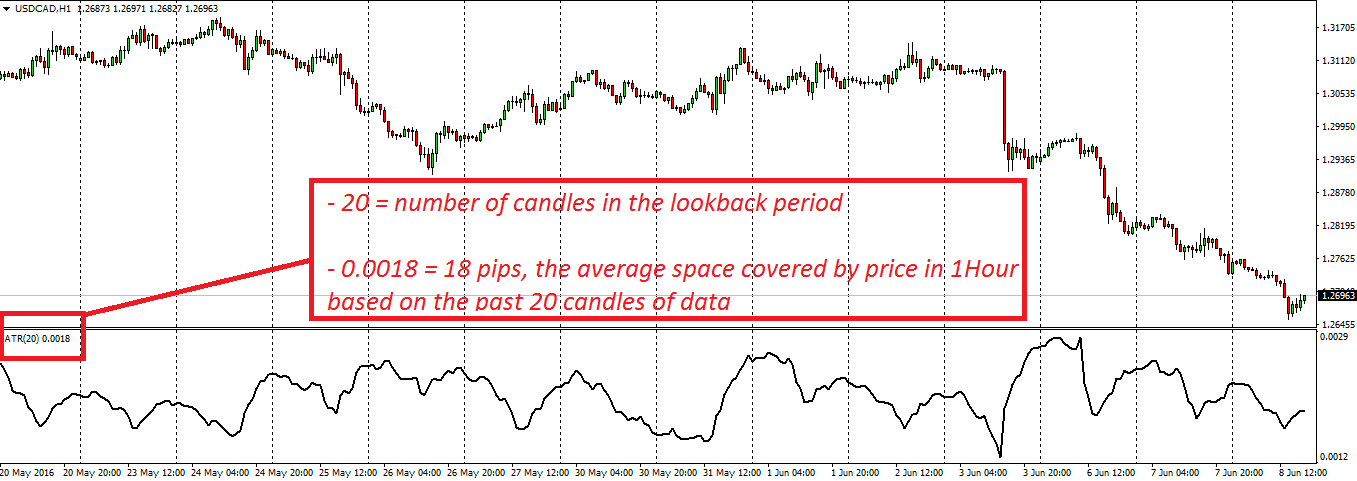
What ATR looks like, on a chart
As with any indicator, it's important to understand how it's built. Let's start with the "True Range" of an asset. The True Range takes into account the current period's range (High - Low) and also compares it with the previous period's close.
TR = maximum between
(current period high - low)
Absolute (current high - previous close)
Absolute (current low - previous close)

Source: Stockcharts.com
The "Average" True Range is something of an exponential moving average of the prior 20 (in our case) True Ranges:
Current 20 period ATR = [(Prior ATR x 19) + Current TR] / 20
And after this brief journey into the math world, it's comforting to know that nowadays most brokers include the ATR as a standard indicator in their charting packages so it is not necessary to do all the work ourselves.
Using ATR to manage entries and exits
Now we know ATR is a measure of volatility. How is this useful? Here is an example:
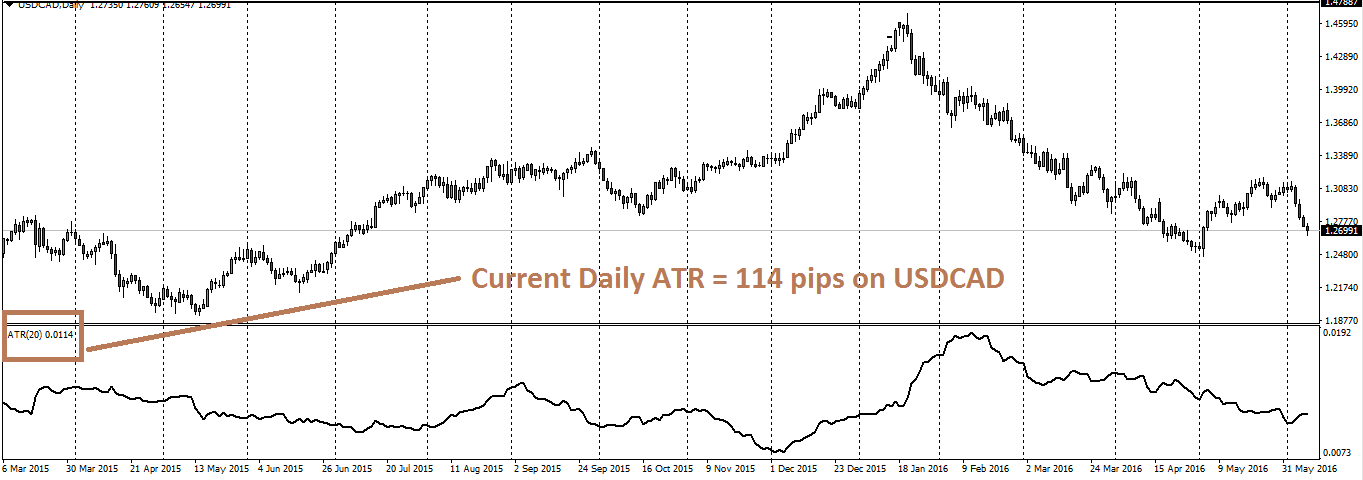
The current Daily ATR on USDCAD is 0.0114 - that's 114 pips. So we know that price has travelled, on average, 114 pips each day during the past 20 days.So let's say we want to short this pair today, during the initial phase of the London Session:

At 7:00 AM, price had travelled a mere 27 pips from high to low; that's only 23% of the Daily ATR. So price has much more space to move, if the market intends to pursue its course.
If the market wanted to print 100% of its ATR today, it could potentially push to 1.2647 (Asian high - 114 pips) or, if it enters a retracement, it could push up to 1.2838 (Asian low + 114 pips). So each day, we have a measure of how much - at the most - price could move.
But price doesn't always cover 100% of its ATR. More often than not, there are cycles of low and high volatility. On average, price tends to cover 70% of its 20 Day ATR. So in our case, that's 70% of 114 pips, which is 80 pips. So that means a potential target for intraday shorts, or a scale out for multi-day shorts, could logically be at 1.2681 (Asian high - 80 pips).
What this also means is that if we were stalking an entry, and price had already moved more than 50% of the 20 Day ATR, then there would not have been much space left to cover. This is quite important, especially for intraday trades, because price needs to have space to move.
For example, AUDUSD was recently pushed higher, as the RBA was less dovish than expected. Waking up during early Europe, this is what traders saw:
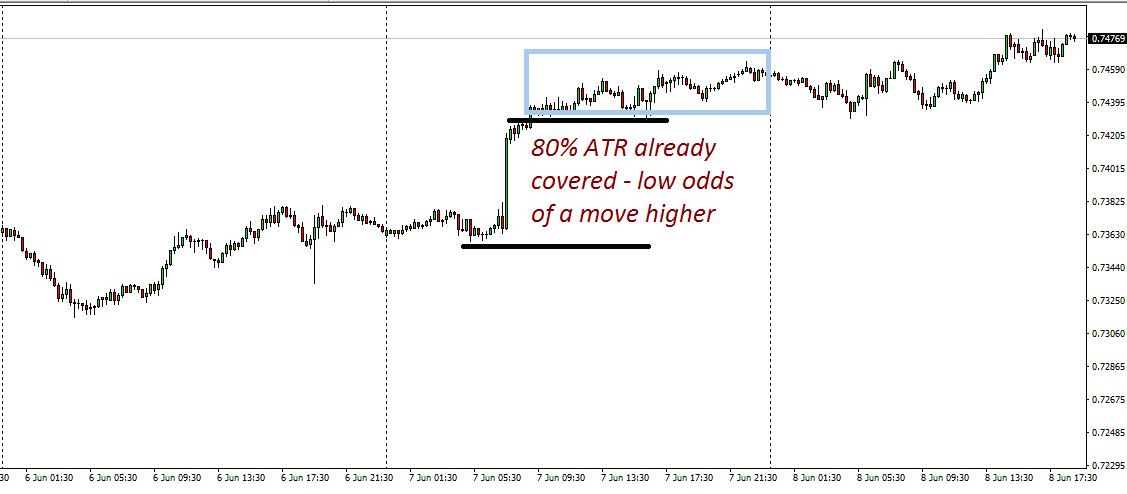
Many traders were looking for another push into London off this news, which would usually be a logical expectation, given that central banks and non-farm payrolls have a large impact on market psychology.
But remember that trading is a game of probabilities. So what is the probability of price pushing aggressively higher? Moreover, if you are taking a long at the London open, where is your stop?
Where does the potential target have to be, in order to achieve even 1R? Taking into consideration these trade management considerations, it really seems like a low probability trade.
So going back to the better example on USDCAD, we were looking for shorts with a target of 1.2681:
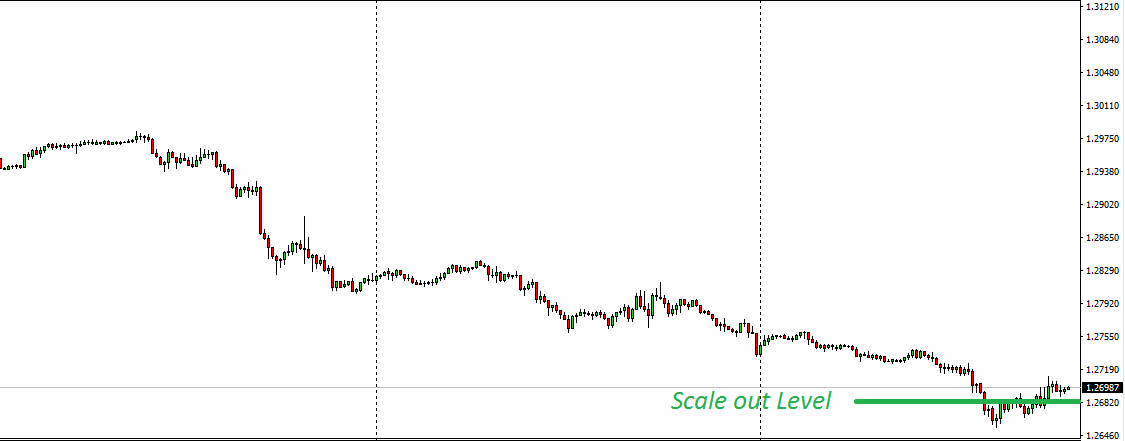
USDCAD 15Min Chart
Price did in fact print a 95% ATR day, before pulling back. Like many things in the markets, the 70% ATR level isn't perfect, but it is measured consistently and works more often than not.
More importantly, having a clear boundary for taking or avoiding trades (50% mark) and a clear scale out/target (70% mark) and a clear expectation of volatility (100% ATR) allows consistent planning.
ATR Pivots - our proprietary indicator
By now, most readers are probably thinking how cumbersome it is to calculate these values each day, and stay aware of how much space price has covered in any given time period. Fortunately, we have the solution: ATR Pivots.
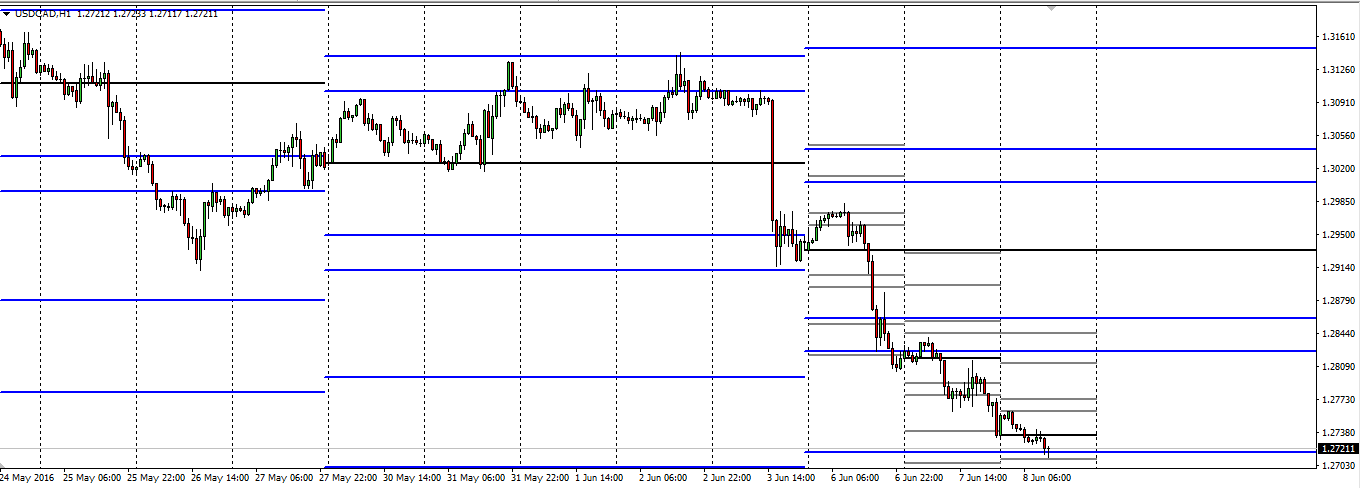
ATR Pivots overlaid on USDCAD
The blue pivots are the weekly pivots. The grey pivots are daily pivots. There are always 4 pivots above the daily & weekly opening price (black) and 4 pivots below the opening price.
All pivot levels are user-defined, but in light of what we said above, logical levels to have the pivots drawn at are:
+100% ATR
+70% ATR
+50% ATR
+25% ATR
Weekly/Daily Open
-25% ATR
-50% ATR
-70% ATR
-100% ATR
So in this way, with minimal clutter on your charts, you always have the key levels highlighted. Here is the breakdown of the inputs. Everything can be customized:

Source: ATR PIVOTS for FXRenew by Craig Consulting
Using ATR to measure trend strength
The benefits of using ATR do not stop with mere entries & exits. Surprisingly, ATR can also help measure the strength of a trend.To illustrate the logic behind this, take 2 currency pairs:
-AUDUSD, has an ATR of 74 pips
-GBPUSD, has an ATR of 127 pips
If we want to play USD weakness, and we want to choose the strongest trend to leg into, how can we possibly compare the performance of the two pairs? They are different in nature: they have a very different volatility profile.
In order to compare apples to apples, and make a logical and consistent decision, we can "scale" their performance by their respective ATRs. How do we do this?
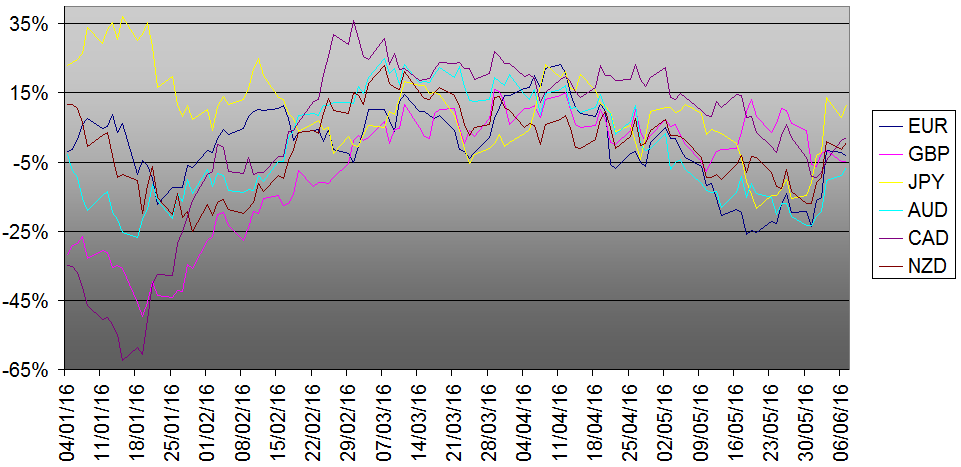
(Current High - Current Low)/20 Day ATR = Current day performance %

Source: Proprietary calculations
The highest score (if comparing uptrends) or the lowest score (if comparing downtrends) is the stronger relative trend.
Traders failing to account for ATR are really only measuring absolute momentum, which makes it difficult to compare apples to apples. Relative momentum is one possible solution.
Here is a chart of the majors' relative momentum scores:
Over to You
Using the Average True Range in a logical and consistent manner can help you:
- Avoid taking trades that have low odds of performing well intraday or intraweek
- Avoid scaling out of a good trade too soon, or holding onto a trade for too long
- Analyze the quality of a trend in an objective manner.
All this makes for consistent, logical and safe trading.
How can you apply the ATR to your trading?
This article was written by Justin C. Paolini, trader and member of the team at www.fxrenew.com.
Want to learn more? Get FREE access to the Advanced Forex Course for Smart Traders
About the Author
Sam Eder is a currency trader and author of the Definitive Guide to Developing a Winning Forex Trading System and the Advanced Forex Course for Smart Traders (get free access). He is the owner of FX Renew, a provider of Forex signals from ex-bank and hedge fund traders (get a free trial).


.png)

