
A better understanding wave analysis

Father of wave market analysis is usually considered Ralph Nelson Elliott, an American financier, analyst, and the creator of the Elliott Wave theory. Studying price charts, he came to a conclusion that the price moves in certain patterns, or structured pictures. Elliott singled out several patterns that always appear on charts, yet can differ in their amplitude and length. Those are the waves in question. Wave analysis is an index of price patterns and explanations how and why those patterns appear on the chart.
Wave types
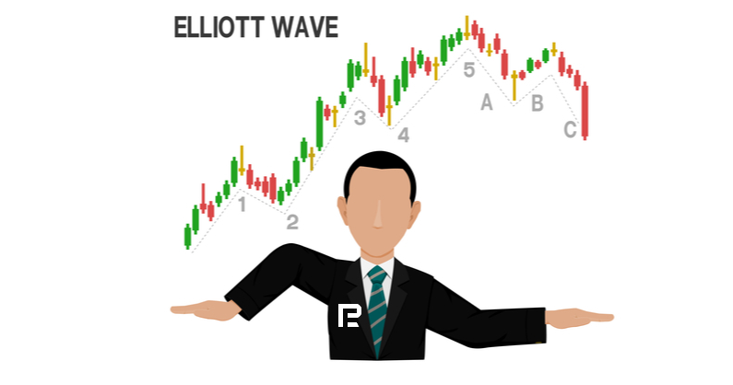
There are only two types of wave movements in the market: momentum or correcting. The momentum movement pattern consists of five waves, while the correcting pattern consists of three waves (pic.1). The momentum movement, in turn, has three waves going in the same direction - waves 1, 3, and 5. Why are they called momentum? Because these waves form the main market trend. As for waves 2 and 4, they go in the opposite direction, correcting the momentum movement. These waves pull back a bit from the preceding wave (the momentum one).

As I have mentioned, patterns are interconnected and repeat constantly. All in all, five waves of the momentum movement create a momentum wave on a larger timeframe, which, in turn, becomes a part of a momentum wave of an even larger timeframe.
Momentum and correcting price movements form a trading cycle. A complete cycle consists of eight waves: five momentum waves by the trend and three correction waves going against the trend (pic. 1). After one cycle is over, another cycle appears at once, with five waves going up and three - going down. However, keep in mind that this cycle will not be identical to the previous one: they will have the same structure (a wave structure of eight waves) but quite a different amplitude and length. Anyway, the main idea of the Wave theory is that any price development going after a wave on a larger timeframe, will consist of five waves on a smaller timeframe; meanwhile, a pullback of a wave on a larger timeframe will consist of three waves on a smaller timeframe.

Elliott himself never mentioned why a market movement must consist of eight waves (five momentum and three correcting ones). He just said that this is how things work. If you take a chart and track price movements on it, you can conclude that the eight wave structure is the necessary minimum that the market needs to develop a trend with pullbacks. You just need to capture the gist: in any instrument, be it gold, euro, dollar, or any other currency, the market always goes in two directions - by the trend and against the trend. There are no exceptions. Even when there is a flat on the market, it does not go horizontally to the right of your screen but bounces up and down very weakly.
Advantages and drawbacks of wave analysis
Wave analysis can be applied on any market without an exception: commodity, stock, or Forex. Naturally, it is applicable to any instrument in the above-mentioned market. There is basically no difference whether you trade grain, or gold, or a currency. All markets have the same movement pattern, and we have already figured out its shape and structure.
As long as I have explained you the market movement pattern and its structure, you need to decide for yourself whether to spend your money on this. So, what are the advantages of the method?
- Studying wave analysis, we study and analyze the market price itself, not its derivatives (indicators or other instruments).
- While trading, we can set price goals: we know after which wave to expect a pullback and where the next momentum will start.
- Studying the behavior of the price, we can see the whole market picture of any scale.
- Based on wave analysis, you can create your own trading strategy, with your own exit and entry rules, risk-to-profit ratio, timeframe, etc.
Now to the drawbacks:
- The method is difficult. You need at least six months to master it from the very start to a somewhat acceptable level.
- The method is subjective. Different traders will draw waves on the same chart and timeframe differently. But if the method is so exact, why do different traders mark waves differently? The answer is simple: everyone uses their own experience and knowledge. The exactness of your waves has a direct connection with your trading experience. An experienced trader knows where to exit a trade before they even enter it.
Anyway, as I have mentioned, any type of market analysis - not only the Wave theory - needs months and even years to yield fruit.
By Dmitriy Gurkovskiy,
Chief Analyst at RoboForex

