USDJPY Live Chart
The USD vs JPY Live Chart is a graph that shows you the price of the US Dollar, vs the Japanese Yen, over a certain amount of time, as well as the USDJPY "live," or current price right now.
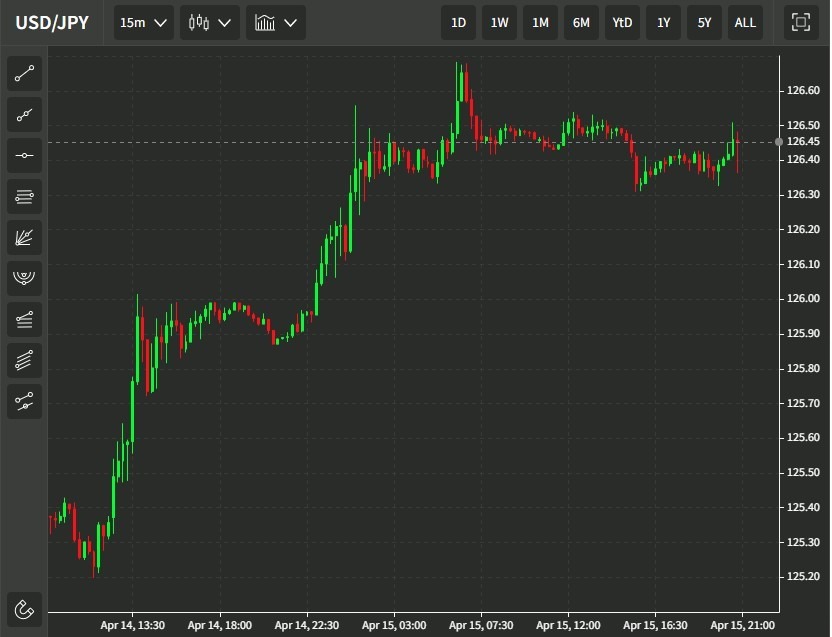
USDJPY Live Rate
1 United States Dollar equals 139.27 Japanese Yen

USDJPY Candlestick Chart
People Asking About the U.S. Dollar (USD) and Japanese Yen (JPY) What is USDJPY?
USD/JPY is the currency pair that shows the value of the US Dollar against the Japanese Yen. The left side of the pair is called base currency, in this case the USD, and the right side is called the quote currency, in this case the Japanese Yen. This exchange rate tells you how many Yen you need to buy one US Dollar. For example, if the USD/JPY pair is trading at 137.50, it means that you need 137.50 Yen to buy one US Dollar. So, when the pair is going up in price, the US Dollar is said to be appreciating or getting stronger and the Japanese Yen is depreciating or getting weaker, and vice versa when the pair is going down in price.
What is a USDJPY Candlestick chart?
There are different ways you can display the exchange rate price movements on a chart. The most common ways include a line chart or a bar chart, but the most popular and used one is the candlestick chart. The candlestick chart shows you instantly and in real time where the price has opened, closed and how much up and down it went on any given timeframe.

Let’s say you want to check USD/JPY price on a daily timeframe. You go to your charting software, select the timeframe and select the candlestick chart (if it’s not set by default). This is what you would see on tradingview.com.

Is USDJPY a good pair to trade?
USD/JPY can be a very good pair to trade when you have a monetary policy divergence between the two central banks backing the currencies, the Federal Reserve for the USD and the Bank of Japan for the JPY. For example, if the Federal Reserve is raising interest rates and the Bank of Japan is keeping them at zero, then you have a policy divergence and, in such cases, you would see the relative currency pair appreciate or going up. Another good thing is that you would be earning interest because you would be buying a currency with a high interest rate and selling one with low interest rate, collecting the differential. This is the so-called carry trade.
When can I trade USD JPY?
The best times to trade a forex pair is when you have the corresponding central banks going in the opposite directions with their monetary policies creating a divergence. The forex market is mainly driven by these interest rates differentials and risk sentiment.
So, when you have a central bank raising interest rates and/or tightening monetary policy you would generally see its currency getting stronger. Then you just need to find a currency with a central bank that is cutting interest rates or keeping them low, find the relative pair for the two currencies and buying the strong currency against the weak one.
So, when you have the Federal Reserve raising interest rates in the US and the Bank of Japan cutting them or keeping them low, you can go long USD/JPY because the interest rate differential will be in favor of the USD.
But when the Federal Reserve starts to cut interest rates, you would see USD/JPY going down, so you can go short, because the rates differential will start to decrease and traders who were taking advantage of the carry trade going long USD/JPY will be taking profits selling USD/JPY, thus increasing the momentum to the downside.
Why is USD JPY important?
USD/JPY is an especially important exchange rate for Japan. The Japanese economy is export oriented and the value of the Yen can impact different things from the profits companies earn to the inflation rate in the overall economy. The Japanese prefer a weak Yen because it increases exports. If the USD is getting stronger against the Yen, then it increases the purchasing power of US consumers and businesses who can buy more Japanese goods and services.
On the other hand, a strong Yen decreases the purchasing power of the US people who may want to buy less Japanese stuff and therefore decreases Japanese exports. The USD/JPY exchange rate is so important for Japan that it’s known for doing interventions in the Forex market to weaken the Yen. For example, Japan with other G7 nations intervened in 2011 after the massive earthquake in Japan to stem Yen strength as the currency appreciated a lot in a short time due to a flight to safety.
Will USDJPY go up or down?
In the current context of massive monetary policy divergence between the Federal Reserve and the Bank of Japan, USD/JPY surged to levels not seen since 1998. But what are the reasons for JPY to appreciate when inflation starts to clearly ease, and the global growth outlook worsens even more? I think the Fed will keep on tightening even during the recession and that will weigh on growth.
This will lower inflation and maybe even lead to some deflation. In turn the Fed will respond with rate cuts and that expectation will depress US yields, making the differential with the Japanese yields to converge and favouring the Yen. The Yen safe haven status coupled with the unwinding of the carry trades we saw up to now on policy divergence, will lead to more and more appreciation.
Should I trade USDJPY or JPYUSD? Does it matter?
There’s no difference between USD/JPY and JPY/USD in terms of currency strength. The only difference lays in how the chart will be displayed and therefore the exchange rate you will see. In the chart below you can see that the two pairs have a perfect inverse correlation because you just swapped the positions of the currencies in the pair.

On the left axis you can see that the exchange rate for JPY/USD is 0.007, which means that you need just 0.007 US Dollars to buy one Yen. On the right axis you can see the exchange rate for USD/JPY showing 138.592, which tells you that you need 138.592 Yen to buy one US Dollar. So, in the end it doesn’t matter at all which currency pair you trade, but if you want to buy the US Dollar, then you will need to go short JPY/USD and long USD/JPY and vice versa if you want to buy Yen.
Why is USDJPY strong?
USD/JPY has been on a strong uptrend for more than a year now. The reason is quite simple: the stark monetary policy divergence between the Federal Reserve and the Bank of Japan. Everything began first with the Democrats winning the majority in the Senate after the elections in Georgia back in January 2021 resulted in a 50-50 split with a tiebreaking vote from Kamala Harris.
From there the market expected more fiscal stimulus from the Democrats and coupled with supply chain issues and the already huge monetary stimulus by the Fed, it led the market to start worrying about inflation and an earlier Fed pivot.
This Fed pivot came in June 2021 as such a hawkish meeting caught the market off-guard and gave the US Dollar the ultimate tailwind to start its massive appreciation.
In 2022 this divergence became even stronger when the Fed started to respond aggressively to combat inflation while the BoJ kept on easing its monetary policy by continuing its quantitative easing program and keeping interest rates at zero. The BoJ is the only dovish central bank in the major currency space as of now.
How to Trade USDJPY?
The best way to trade currencies in general is to have a fundamental idea for direction, which is generally based on macroeconomics such as central bank’s monetary policy, growth, inflation, and so on, and technical analysis for risk management.
For example, let’s say that you have the monetary policy divergence between the Fed and the BoJ telling you that fundamentally the pair should go up. So, you will want to mainly take long positions. You also need to manage your risk though. Where can you enter to have a small risk exposure but a bigger profit potential? You can use technical analysis.
So, you open the USD/JPY chart and use technical concepts like support and resistance, trendlines, indicators and so on to decide where to open a trade. For example, in the chart below you can see how you could use the upward trendline on the 1-hour timeframe as support to lean against.
You could have placed an order when the price touched the trendline and a stop loss below the trendline and the recent low to protect your position so if the price broke down you would lose just a little. The possible gain though could have been much bigger as you would have pocketed six times more than you risked in that trade.

Where can I trade USDJPY?
You can trade USD/JPY or any other Forex pair with a broker. Always choose a good, reputable, and regulated broker to avoid unnecessary problems. When you open a trading account with a broker, you will have to deposit money to be able to trade and then use the broker trading platform to execute your trades. Most retail brokers let you trade on MetaTrader 4 or MetaTrader 5, which are two of the most famous and popular trading platforms among retail traders.
Most retail brokers offer CFD trading for Forex, although you can also trade USD/JPY via other derivatives like futures or options that are more expensive than CFDs, or you can buy ETFs like ProShares UltraShort Yen with ticker “YCS” (long USD/JPY) or ProShares Ultra Yen with ticker “YCL” (short USD/JPY).
USDJPY Analysis
FUNDAMENTAL ANALYSIS: As of now the stark monetary policy divergence between the Federal Reserve and the Bank of Japan is still intact. This keeps on supporting the USD/JPY pair especially considering recent comments both from the Fed, which favors a tighter for longer monetary policy even if the economy goes into recession and the BoJ, which keeps on reiterating its commitment to maintain monetary policy loose for the foreseeable future.
The things to look at for a change in this trend is inflation in the US. The Fed is “all in” in fighting inflation and wants it to return to its 2% target even if it means a recession. Given their strong will, it’s hard to fight the Fed as it may overtighten policy and cause even more appreciation in the USD/JPY pair if the BoJ continues to shy away from tightening monetary conditions.
The market though is forward-looking in nature and generally prices changes in fundamentals 6/12 months ahead. So, what may trigger downsides in the pair? Economic indicators like CPI and others that include components that show inflationary pressures like the ISM PMIs can act as catalysts that can send the pair lower if they miss on expectations, and the bigger the miss the bigger the reaction that will be seen. Given that we may be at peak inflation and probably near the peak hawkishness for the Fed, the risk management becomes paramount when trying to trade the pair.
TECHNICAL ANALYSIS: On the monthly timeframe, we can see the most clear and strongest levels of support and resistance. The nearest one is found in the 145.000 price area. The uptrend should find a great resistance there especially if inflation reports start to miss and the Fed becomes less hawkish.

On the daily timeframe, we can see how the price is contained in what could become a broadening wedge. This chart pattern is divergent in nature, meaning that the price is losing momentum and can reverse the trend. We may see the price coming to the upper trendline and the monthly resistance zone and finally start a long-term downtrend.

On the 4-hour timeframe, we have the price respecting the upward trendline. A break of the recent swing high at 139.440 to the upside may increase the momentum to try reaching the 145.000 price area. If the price breaks the trendline to the downside, it may signal a loss of momentum and the price pulling back to the lows near the 135.000 area or even 131.000 before either resuming the upward trend or breaking the strong support in the 131.000 area.

USDJPY Correlation
The USD and JPY are both considered safe haven currencies. Safe haven assets see inflows in times of stress or risk aversion in the market. The JPY is generally the best safe haven currency and the one seeing the most inflows in bad times. In fact, what drives the USD/JPY pair the most is monetary policy divergence between the Fed and the BoJ and risk sentiment.
In normal times, when there’s risk on sentiment you can see the USD/JPY appreciating all else being equal, while during risk off flows you can see the JPY gaining strength. The other driver as previously mentioned is monetary policy divergence. This divergence increases or decreases the so-called yield spread, which is the differential between US Government Bonds returns versus the Japanese ones. Investors generally want the highest profits for the least amount of risk.
So, when the US yields are rising investors prefer to buy US assets which means selling Yen and buy US Dollars and vice versa when yields in US fall or the Japanese ones rise. In the chart below you can see how the USD/JPY pair is correlated with the spread between the US and JP bond yields.
Moreover, you can see how the yield spread is a leading indicator for the FX pair as the divergence between the yield spread and the FX pair was getting wider between August 2020 and December 2020, but then finally the FX pair caught up with the yield spread once the catalyst from the January 2021 elections in Georgia gave the market a wake-up call.

