
It’s only taken a few trading days to see the power of the August bid for bonds. It started on Friday as yields fell despite worries about Fed hikes. A sell-off on July 30 has now been almost completely reversed.
This chart shows the seasonal pattern in 10-year Treasury yields. On average and since 2005, August is the best month for bonds (worst for yields).
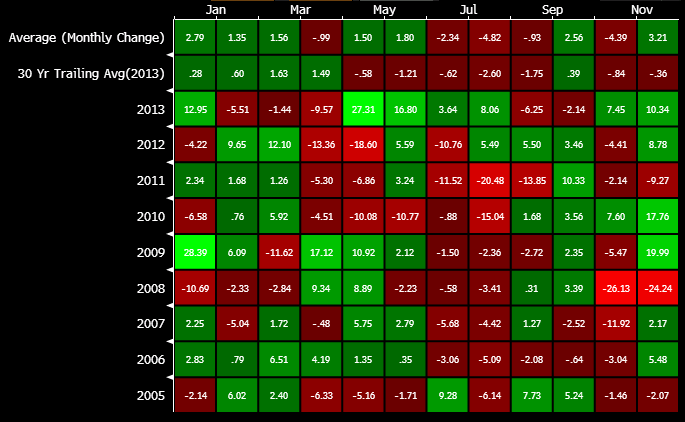
US 10 year yields seasonals
A break in the 2.45%/2.40% support zone could spark an extended rally in bonds.

