
Typically, because of the nature of Forexlive.com, I focus on the market in the shorter term. Where is the risk? What is the bias? Where are trading levels?
Earlier today, I wanted to see the the 38.2%-50% hold corrections (see chart below) and the price held the 38.2% but could not sustain momentum on the one look below the 1.2500 level below. The subsequent rally has taken the price to the 50% retracement level and that is trying to limit the move currently. It is Friday though, so anything can happen.
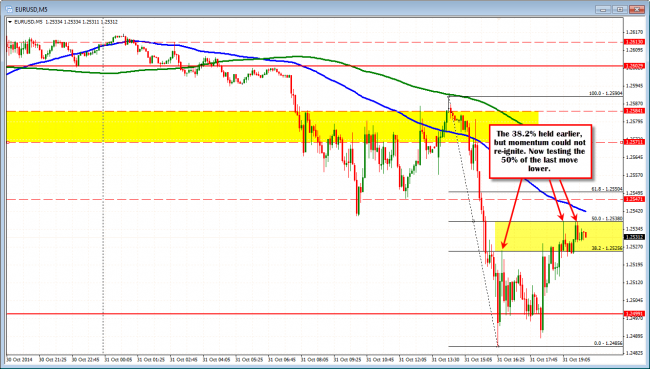
EURUSD testing intraday resistance in Friday afternoon trading.
With the FOMC more hawkish and the ECB more dovish, the fundamental backdrop continues to support a lower EURUSD. If that bias continues, what about some longer term thoughts? What are the longer term charts saying?
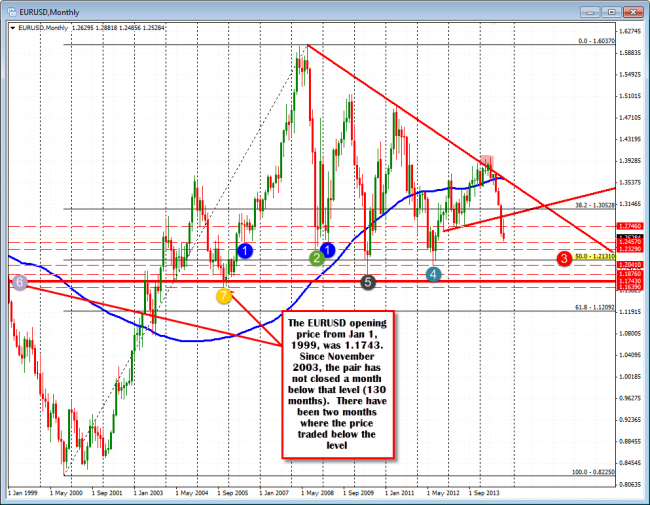
The EURUSD came into existence in January 1, 1999 at 1.1743. The first month of trading in the pair reached a high at the 1.1860. The close that month was at 1.1368 and it was not until the month of May 2003 before there was another close above the 1.1743 level (the close was at 1.1774 that month). It took an additional 5 months – in November 2003 – before the price was able to extend and close above that 1.1743 level again.
Since that time (in November 2003), the price on a monthly basis, has traded below the 1.1743 level during two successive months in November/December 2005, but there have been zero – yes zero – closes below the introduction price since the November 2003 break higher.
The global debt crisis, then the European sovereign debt crisis in 2010 could not push the price below the opening level . The low during that period came in June 2010 at 1.1876. The chatter at the time was focused on parity for the pair. It was not to be.
The targets to the downside for the EURUSD will step through the lows from the last 11 years.
WHERE DOES THE CURRENT PRICE STAND HISTORICALLY.
At 1.2537,
- The price is currently still around 800 pips above the opening level.
- From the low of 0.8225 reached in October 2000 to the high of 1.6037 reached in July 2008, the price is above the 50% midpoint of the all-time range at the 1.2131.
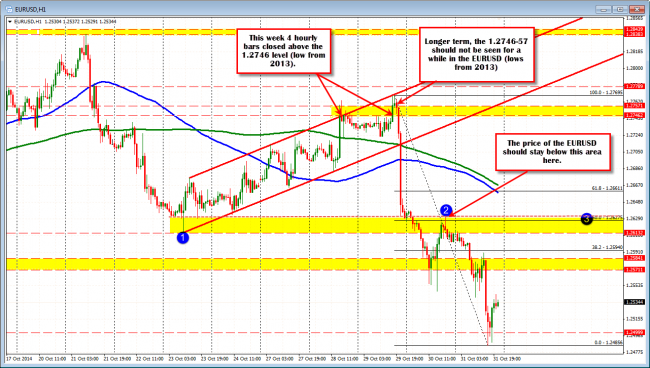
- The price is below the 2013 low at the 1.2746. This week, at the highs before the more hawkish FOMC statement, the price closed above the 1.2746 level on 4 separate hourly bars. The high this week extended to 1.2769 before tumbling lower.
- Last month the price fell below trend line support (see monthly chart above) and stayed below this month.
Next week the ECB meets and the expectation is for no change, but the potential exists for additional action and/or a more dovish press conference. The US Unemployment will be released on Friday. The expectations are for a NFP to rise by 234K vs 248K last month. The Initial Claims 4 week average is at the lowest level since 2000.
The bias for the EURUSD should continue to be to the downside.
WHERE ARE THE DOWNSIDE TARGETS?
Assuming the trend continue, where are the next downside targets?
Looking at the monthly charts, the major lows become targets. They include (see numbered levels in the monthly chart above):
- 1.2457 – This is the low from 2009 and also a low price from 2006
- 1.2329 – low from 2008
- 1.2131 – 50% of the all time trading range
- 1.2041 – low from 2012
- 1.1876 – low from 2010
- 1.1743 – the EURUSD opening value from January 1, 1999
- 1.1639 – low from 2005
I would think that the 1.2131 should provide some good support on the first test and also a tough level to get below. If done, however, I would think that the market will start to sniff the post crises low at the 1.1876 and the 1.1743 level will also be a magnet attraction.
Now, the above is assuming the bears remain in control, and understand that the move will not be in a straight line if it does go (hence tune into ForexLive.com!).
WHERE IS THE RISK NOW?
Where is “line in the sand risk” for the pair now?
A level that is higher than risk I normally take from current levels – but nevertheless, a key line in the sand now- is at the 1.2746-57 area.
This was the lows from 2013 and as mentioned above, the price highs this week, had only four hourly bar closes that reached above this level. We should not see the price trade above this level for a while now (if not a long extended time period). If it does, something else is up which I don’t see.
Closer resistance for me come in at the 1.2613-31 area. The 1.2613 is the low from last weeks trading. The 1.26275 is the 50% of the range this week, and the high from yesterday afternoon peaked at 1.2631 (see chart below). This is where there should be close resistance in trading next week. A move above and expect a test of the 100 and 200 hour MA (blue and green lines in the chart below).
SUMMARY
This week had some key moments technically and fundamentally. With the ECB on tap next week, along with the US Employment which should continue to show solid job gains, the prospects of the continuation of EURUSD selling that was started after the FOMC, should continue in trading going forward. The fundamentals and technicals are in agreement.
The hourly chart defines risk for the EURUSD in next weeks trading.

