
Fed Dot Plot
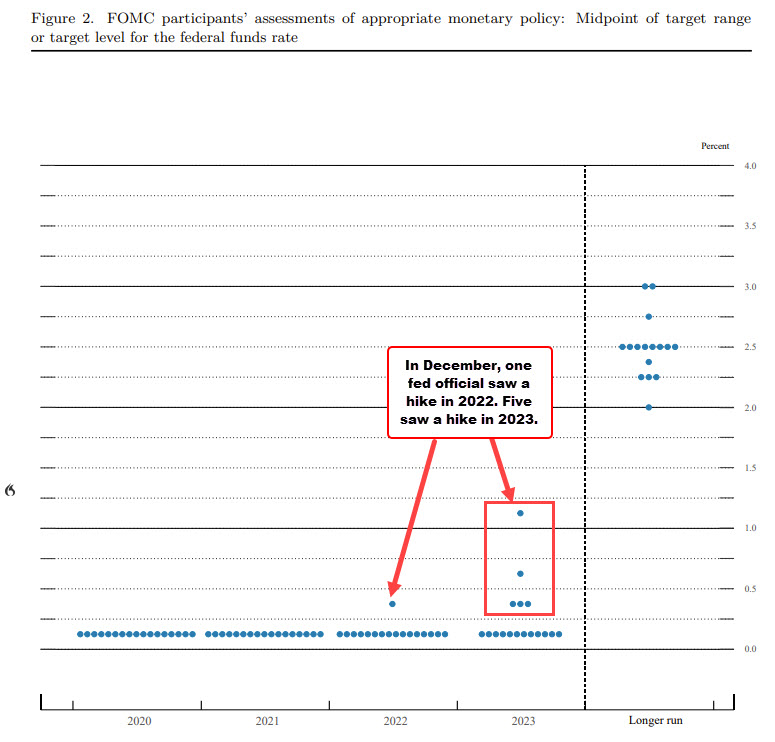
Below is the dot plot from the March meeting. At the time, 1 Fed official saw a hike in 2022, and 5 saw a hike in 2023.
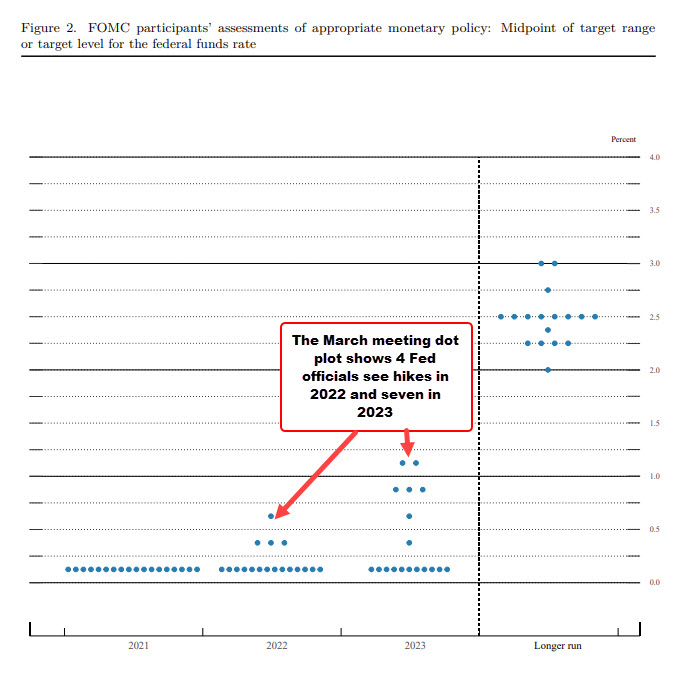
The Dot plot for March sees four Fed officials expecting hikes in 2022 and seven Fed officials in 2023.
The central tendencies for 2021 sees
- GDP higher. The central tendencies went from 3.7% to 50% to 5.8% to 6.6%
- Unemployment lower, The central tendencies went from 4.7% – 5.4% to 4.2% – 4.7% and
- PCE inflation higher. Central tendencies went from 1.7% – 1.9% to 2.2% – 2.4%. Core PCA four 2021 one from 1.7% – 1.8% to 2.0%-2.3%
In 2022, inflation is modestly higher but still mostly below 2% for headline and core inflation. GDP growth has a higher upper limit at 3.8% versus 3.5%. Unemployment is expected be lower at 3.6% – 4% versus 3.8% – 4.6% in December.
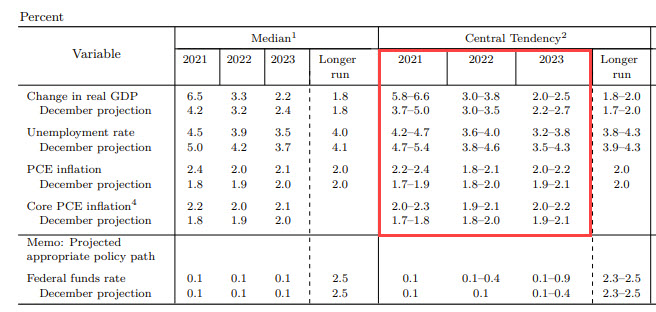
Key takeaways are that growth is higher, inflation is higher, but Fed officials are not concerned about those dynamics in 2021. In 2022 that she inflation moving back lower toward the 2% level. In 2023, more officials are expecting a hike, but inflation is expected to remain plus or minus around 2%.
In the short term, the picture from the Fed is more of a Goldilocks scenario with stronger growth, mostly higher inflation, lower unemployment no threat for Fed hikes

